Question
How should the contents of the Data Detail tab be understood?
Answer
This data is well-suited for understanding the rationale behind the Modulation criterion.
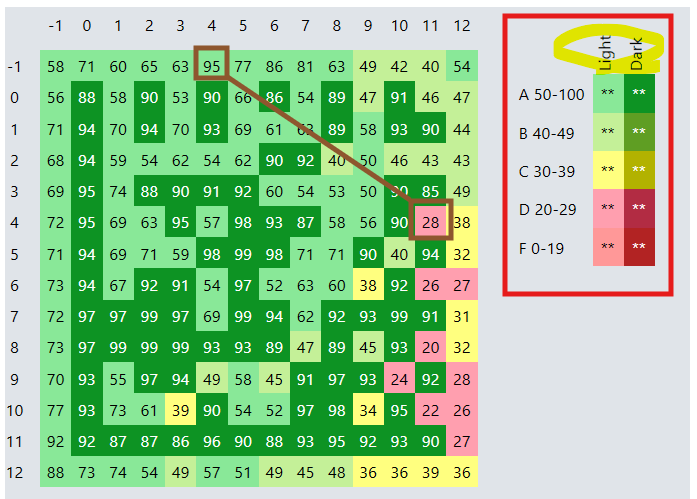
Rating Table on the Right: Grades(Colors) are assigned based on the 'Light' and 'Dark' columns.
1-1. Light Column: Represents the brightness level of each code cell.
1-2. Dark Column: Represents the darkness level of each code cell.
Example:
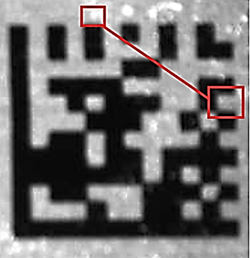
In the above image, the cell located at (4, -1) was measured with a brightness level corresponding to grade A, while the cell at (11, 4) was assessed with a brightness level corresponding to grade D.
The contrast in brightness between these two cells is also observable in the image of the actual scanned code provided below.