CompareImage
CompareImage compares a template image with an input image to produce a greyscale output image where every pixel represents the normalized difference.
CompareImage Overview
CompareImage is designed to extract a template from the current image when the ForceTrain checkbox in the property sheet is selected. After the user deselects the checkbox, CompareImage can map the pixels from the template to the input image for comparison and for producing the greyscale output image. Pixels that do not match the template image within a certain tolerance are displayed as bright or white pixels.
CompareImage Inputs
Syntax: CompareImage(Image,Fixture.Row,Fixture.Column,Fixture.Theta,Region.X,Region.Y,Region.High,Region.Wide,Region.Angle,ForceTrain,Edge Range,Interpolation,Show)
| Parameter | Description | ||||||||||
|---|---|---|---|---|---|---|---|---|---|---|---|
|
This parameter must reference a spreadsheet cell that contains an Image data structure. By default, this parameter references A0, the cell containing the AcquireImage Image data structure. This parameter can also reference other Image data structures, such as those returned by the Vision Tool Image functions. For more information, see AcquireImage and Image. |
|||||||||||
|
Defines the Region of Interest (ROI) relative to a Fixture input or the output of a Vision Tool function's image coordinate system. Setting the ROI relative to a Fixture ensures that if the Fixture is rotated or translated, the ROI will be rotated or translated in relation to the Fixture. For more information, see Fixture and Vision Tools. Note: The default setting is (0,0,0), the top leftmost
corner of the image.
|
|||||||||||
|
Also known as the Region of Interest (ROI), specifies the region of the image that undergoes analysis and creates a rectangular image region that can be transformed and rotated. For more information, see Interactive Graphics Mode. Tip: With this parameter
selected, you can press the Maximize
Region button on the property sheet's toolbar to maximize the region and cover the entire image.
|
|||||||||||
|
Specifies when the template is extracted from the current image: either when the ROI dimensions are modified, or when the ForceTrain parameter is selected.
|
|||||||||||
|
Specifies the number of pixels (0–24; default = 3) around an edge that will be tolerated during the image comparison. The higher the number, the less rigorous the edge matching between the template and the input image (in other words, the less likely imperfectly matched edges will be depicted as differences in the output image). |
|||||||||||
|
Specifies the type of pixel comparison to perform when mapping the template to the input image to produce the output image of the differences.
|
|||||||||||
|
Specifies which graphical overlays are displayed on top of the image.
|
CompareImage Outputs
|
Returns |
An Image data structure containing the processed image, or #ERR if any of the input parameters are invalid. For more information, see Structures. |
CompareImage Example
In this example, the goal is to use CompareImage to compare the template image of a "good" gasket with input images of gaskets on a production line.
- After inserting CompareImage into the spreadsheet, define the ROI by double-clicking on the word "Region" in the property sheet, which disappears to reveal the red ROI box overlaid on the image.
- Move or resize the box using the cursor, and click the OK
 button on the Job
Edit toolbar (or presses the Enter key) to confirm the selection and return to the property sheet.
button on the Job
Edit toolbar (or presses the Enter key) to confirm the selection and return to the property sheet. - Now you can fixture the tool to another data structure. In fixturing, you can identify a distinctive feature that appears on all instances of the object and designate it as a reference point for subsequent vision tools. This allows precise comparisons or inspections to be made, even if the object is slightly rotated or shifted on the production line. To fixture the function, click the word "Fixture" in the property sheet and click either the Absolute Reference
 or
Relative Reference
or
Relative Reference button on the property sheet's toolbar. The property sheet disappears, revealing the In-Sight spreadsheet.
 - Move the cursor to select the Row, Column and Angle cells from another data structure in the spreadsheet (for example, FindPatterns) as the reference for the fixture, and click the OK button on the Job
Edit toolbar (or press the Enter key) to confirm the selection and return to the property sheet.
-
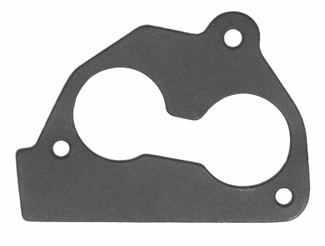
Next, verify the ForceTrain checkbox in the property sheet is selected, so that a template image (below) can be extracted automatically when an image acquisition is manually triggered.
Tip: Simply selecting the ForceTrain checkbox triggers the image acquisition, so if the current image is acceptable, the you can skip setting up the image and manually triggering the acquisition.Once a template is selected, deselect the checkbox to prevent overwriting the template.
-
You can now accept the default settings of the other parameters and click OK in the property sheet to complete the configuration for this example and apply the function to the input image.
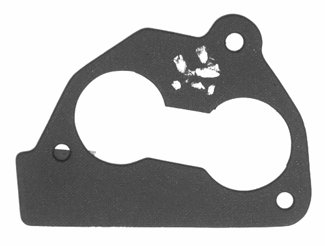
During run time, the tool compares the template image with the input image. A "bad" input image might consist of a gasket marred by white marks (below).
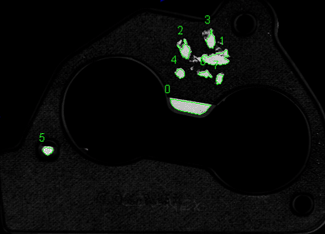
Differences between the two are displayed as bright pixels in the greyscale output image (below).
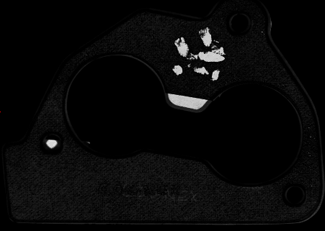
Another tool (for example, ExtractBlobs; see below) can reference the output image to make a decision about whether the gasket passes or fails inspection.