EditPolylinePath
Inserts an interactive composite one-dimensional polyline region control into the spreadsheet. When the control is clicked, the display switches to Interactive Graphics Mode, where the polyline path can be modified. For more information, see Interactive Graphics Mode.
- To access the property sheet for EditPolylinePath, right-click the EditPolylinePath control and select Edit Function.
- A right-click menu is available during graphical editing, which allows you to add a path segment or delete a path segment.
- The InspectEdgeForDefect function can not be used in conjunction with an InspectEdge function that utilizes an EditPolylinePath function as an external region.
- The Maximize Region button is disabled for EditPolylinePath.
EditPolylinePath Inputs
Syntax: EditPolylinePath(Image,Fixture.Row,Fixture.Column,Fixture.Theta,Add Segment,Remove Segments,Edit Segments,Move,Size,Rotate,Name,Show)
| Parameter | Description | ||||||
|---|---|---|---|---|---|---|---|
| Image | This parameter must reference a spreadsheet cell that contains an Image data structure; by default, this parameter references A0, the cell containing the AcquireImage Image data structure. This parameter can also reference other Image data structures, such as those returned by the Vision Tool Image functions or Coordinate Transforms Functions. For more information, see Image or Coordinate Transforms Functions. | ||||||
|
Specifies the image coordinate system in which the input composite region is defined.
|
|||||||
|
If checked, a point can be added to the polyline while in the Interactive Graphics Mode. |
|||||||
|
If checked, points can be removed while in the Interactive Graphics Mode. |
|||||||
| Move Points | If checked, points can be moved while in the Interactive Graphics Mode. | ||||||
|
If checked, the entire polyline path can be moved while in the Interactive Graphics Mode. |
|||||||
|
If checked, the entire polyline path can be scaled while in the Interactive Graphics Mode. |
|||||||
| Rotate | If checked, the entire polyline path can be rotated in the Interactive Graphics Mode. | ||||||
|
Specifies a text label for the EditPolylinePath control element in the spreadsheet. |
|||||||
|
Specifies the display mode for the EditPolylinePath graphics overlay on the image.
|
EditPolylinePath Outputs
|
Results |
An EditRegion |
 control.
EditPolylinePath Interactive Graphics Mode
|
||
|---|---|---|
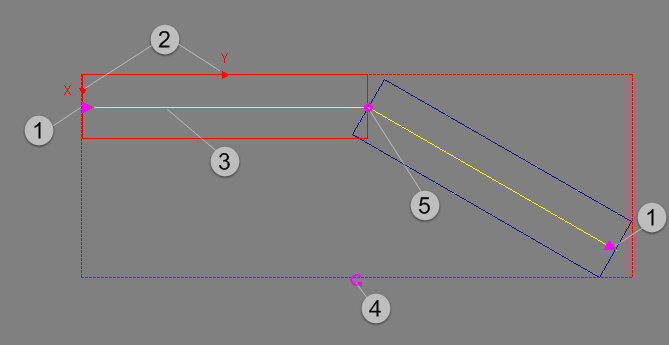
| Item | Controls | Description |
| 1 | End Points | Defines the first and last points of the polyline. The triangle shape indicates the polyline path direction. |
| 2 | Scan Direction Indicator | Defines which direction the polyline will scan for features. |
| 3 | Polyline Path | Graphically displays the plot of the polyline. |
| 4 | Rotation Handle | Allows the ROI to be rotated 360°. |
| 5 | Polyline Path Vertices | Defines the path of the polyline segment(s). Click on a vertices to position the polyline. |
EditPolylinePath Mouse Actions
By placing the mouse cursor over various parts of the ROI, the mouse cursor will automatically transform, enabling the following actions:
| Mouse Icon | Description |
|---|---|

|
Allows you to drag the entire ROI anywhere within the image. |

|
Allows you to scale either the entire ROI horizontally or vertically, or the ROI surrounding the polyline horizontally or vertically. |

|
Allows you to rotate the entire ROI 360° from its current orientation. |

|
Allows you to move the polyline within the ROI. |

|
Allows you to add a point to the polyline path. Up to 99 points may be added to a polyline. If 99 points have been added to a polyline, this option is disabled. |
EditPolylinePath Right-click Context Menu
| Right-click Location | Context Menu |
|---|---|
| Over a Point |
|
| Over an Edge |
|