ImageMath
A multipurpose function, ImageMath produces a greyscale or black-and-white output image where every pixel is the result of an arithmetic operation—for example, addition, subtraction or averaging—performed between two input images. For more information, see Image.
- From In-Sight firmware 5.2.0 and later, the function's algorithm has been changed to use a newer algorithm. Due to this change, the Display Row and Display Column parameters have been added to this function, and the Results Alignment parameter, the Advanced Options parameters and the AND, OR and XOR options (Operation parameter) have been removed from this function.
- When loading a job containing an ImageMath function configured on the In-Sight firmware 5.1.x or earlier to an In-Sight vision system running firmware version 5.2.0 or later, the Result Alignment parameter and the Advanced Options parameters are automatically removed from the function, and the Display Row parameter and the Display Column parameters are set to the default value (0, 0). If the ImageMath function is configured to use AND, OR or XOR options, the function will return #ERR.
- When attempting to load a job containing an ImageMath function configured on the In-Sight firmware 5.2.0 or later to an In-Sight vision system running firmware version 5.1.x or earlier, an error message will be displayed and the job load will fail.
- The ImageMath function configured on the In-Sight firmware 5.1.x or earlier can pass calibration through to any subsequent tools if Image 1 Origin or Image 2 Origin is selected as the Results Alignment option (if Sensor Origin is selected, the results will be in pixels). For more information, see Calibrate Functions. However, the ImageMath function configured on the In-Sight firmware 5.2.0 or later cannot pass through calibration. To convert pixel measurements into real-world coordinates, you have a couple of options.
- Use the Transform function for the tool (e.g. TransBlobsToWorld). For more information, see TransBlobsToWorld.
- Pass the ImageMath function through a CalibrateImage function with the desired calibration, and then use the CalibrateImage as an input to the subsequent tools. For more information, see CalibrateImage.
ImageMath Inputs (In-Sight 5.2.0 or Later)
Syntax: ImageMath(Image 1,Image 2,Operation,Display Row,Display Column,Show)
| Parameter | Description | ||||||||||||||||||||||||||||||||||||||||||
|---|---|---|---|---|---|---|---|---|---|---|---|---|---|---|---|---|---|---|---|---|---|---|---|---|---|---|---|---|---|---|---|---|---|---|---|---|---|---|---|---|---|---|---|
|
This argument must reference a spreadsheet cell that contains a valid Image data structure. By default, the cell referenced is A0, which contains the Image data structure returned by AcquireImage. For more information, see AcquireImage. |
|||||||||||||||||||||||||||||||||||||||||||
|
This argument must reference a spreadsheet cell that contains a valid Image data structure. By default, the cell referenced is A0, which contains the Image data structure returned by AcquireImage. |
|||||||||||||||||||||||||||||||||||||||||||
|
Specifies the image-processing operation that will produce a greyscale or black-and-white output image.
|
|||||||||||||||||||||||||||||||||||||||||||
|
Specifies the Row coordinate (default = 0) where the output image will be displayed, relative to the upper left-hand corner. |
|||||||||||||||||||||||||||||||||||||||||||
|
Specifies the Column coordinate (default = 0) where the output image will be displayed, relative to the upper left-hand corner. |
|||||||||||||||||||||||||||||||||||||||||||
|
Specifies which graphical overlays are displayed on top of the image.
|
ImageMath Inputs (In-Sight 5.1.x or Earlier)
Syntax: ImageMath(Image 1,Image 2,Operation,Results Alignment,Advanced Options.Divisor,Advanced Options.Greyscale Offset,Show)
| Parameter | Description | ||||||||||||||||||
|---|---|---|---|---|---|---|---|---|---|---|---|---|---|---|---|---|---|---|---|
|
This argument must reference a spreadsheet cell that contains a valid Image data structure. By default, the cell referenced is A0, which contains the Image data structure returned by AcquireImage. |
|||||||||||||||||||
|
This argument must reference a spreadsheet cell that contains a valid Image data structure. By default, the cell referenced is A0, which contains the Image data structure returned by AcquireImage. |
|||||||||||||||||||
|
Specifies the image-processing operation that will produce a greyscale or black-and-white output image.
|
|||||||||||||||||||
|
Specifies the location of the output image after it has undergone the image-processing operation.
|
|||||||||||||||||||
|
Specifies the additional mathematical modifications that can be applied to a greyscale output image. The order of operation is (1) divide and (2) offset.
|
|||||||||||||||||||
|
Specifies which graphical overlays are displayed on top of the image.
|
ImageMath Outputs
|
Returns |
An Image data structure containing the processed image, or #ERR if any of the input parameters are invalid. |
ImageMath Example
In this example, the goal is to produce an output file of only the holes in a gasket. Later, the holes will be referenced by another tool so that decisions can be made regarding the holes.
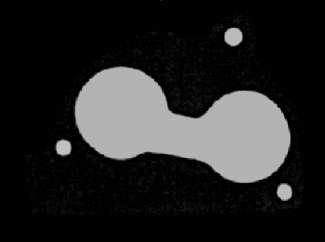
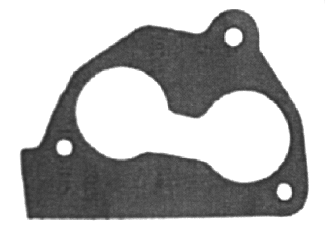
For Image 1, the user acquires an image of the complete gasket (below).
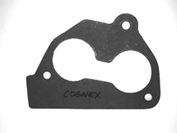
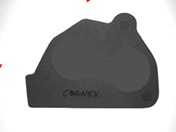
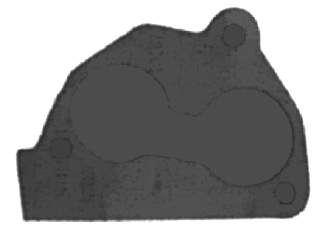
The user would like Image 2 to be a copy of Image 1, but with all the white holes filled. To produce this, the user inserts the Filter function into the spreadsheet and, in the property sheet, maximizes the ROI by selecting the word "Region" and clicking the Maximize Region  button in the property sheet's toolbar. Maximizing the ROI ensures that the ROIs of Image 1 and Images 2 are the same size. For more information, see Filter.
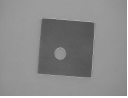
Selecting "Fill Light Holes" from the Operation pull-down menu, accepting the default settings of the other parameters and clicking OK in the Filter property sheet completes the configuration for this example and applies the function to the input image (see result, below).
The user then inserts the ImageMath function into the spreadsheet and, in the property sheet, accepts A0 as Image 1. Now, the Filter output image must be referenced as the source for Image 2. The user double-clicks on the words "Image 2" in the property sheet, which disappears to reveal the In-Sight spreadsheet. The user clicks on the Image
data structure returned by Filter and clicks the OK  button on the Job
Edit toolbar to confirm the selection and return to the ImageMath property sheet. (The selection can also be confirmed by pressing the Enter key or by double-clicking on the Image
data structure.)
button on the Job
Edit toolbar to confirm the selection and return to the ImageMath property sheet. (The selection can also be confirmed by pressing the Enter key or by double-clicking on the Image
data structure.)
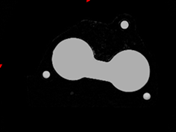
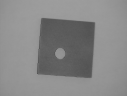
Selecting "Differences" from the Operation pull-down menu, accepting the default settings of the other parameters and clicking OK in the ImageMath property sheet completes the configuration for this example and applies the function to the input image.
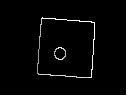
The result is an output image of only the holes in the gasket (below).