EditCompositeRegion
Inserts an interactive composite region control into the spreadsheet. When the control is clicked, the display switches to Interactive Graphics Mode, where the composite region can be modified. A composite region can consist of multiple subregions. A subregion can be an Annulus, Circle, Polygon, or Region. Each subregion is an add operation (included in the image analysis) or subtract operation (excluded from the image analysis). The subtract operation is also known as "masking". For more information, see Interactive Graphics Mode, Annulus, Circle, EditPolygon, or Region.
-
To access the property sheet for EditCompositeRegion, right-click the EditCompositeRegion control and select Edit Function.
-
A maximum of 32 subregions can be added to the composite region.
-
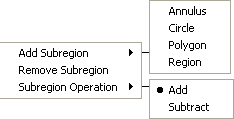
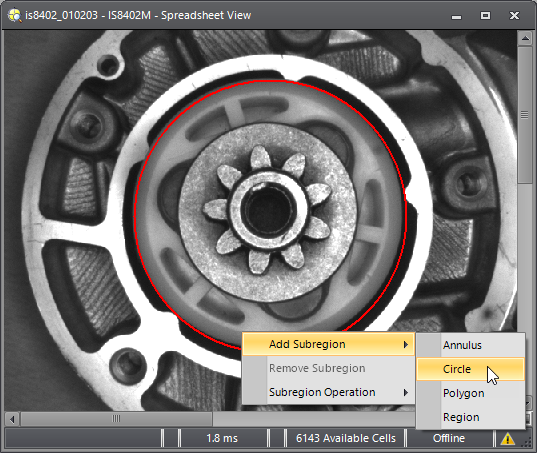
A right-click menu is available when in Interactive Graphics Mode, which allows you to add or remove a subregion, or change a selected subregion's operation (add or subtract):
General Tab
The General tab is used to define the parameters of the EditCompositeRegion function.
EditCompositeRegion Inputs
Syntax: EditCompositeRegion(Image,Fixture.Row,Fixture.Column,Fixture.Theta,Add Subregions,Remove Subregions,Edit Subregions,Move Entire Composite,Rotate,Name,Show)
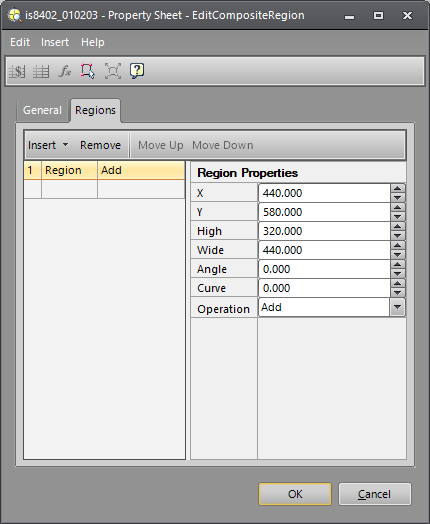
Region Tab
The Regions tab allows you to insert, remove and edit subregions. A subregion can be an Annulus, Circle, Polygon or Region that is used to perform an add or subtract operation.
Region Tab Controls
-
Insert: Inserts an Annulus, Circle, Polygon or Region subregion.
-
Remove: Removes the highlighted subregion from the list.
-
Move Up: Moves the highlighted subregion up in the list.
-
Move Down: Moves the highlighted subregion down in the list.
Note: The composite region is built in sequence, based on the order of the subregions within the list. For more information, see Order of Subregions. - Subregion Properties: Displays the properties for the highlighted subregion.
EditCompositeRegion Output
|
Results |
A labeled Button control. |
EditCompositeRegion Example
Opening the EditCompositeRegion Property Sheet
-
Right-click cell A2 and select Insert Function to open the Insert Function dialog.
-
In the left side of the Insert Function dialog, expand the Graphics list of tool categories.
-
Select the Controls tool category.
-
Select the EditCompositeRegion function from the function list and press the OK button or double-click the function name.
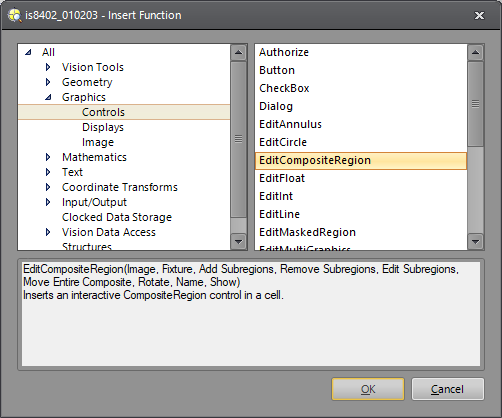
- The EditCompositeRegion property sheet opens.
General Tab
-
Optionally, expand the Fixture parameter and specify the Row, Column and Theta values. Setting the composite region relative to a fixture ensures that if the fixture is rotated or translated, the composite region will be rotated or translated in relation to the fixture.
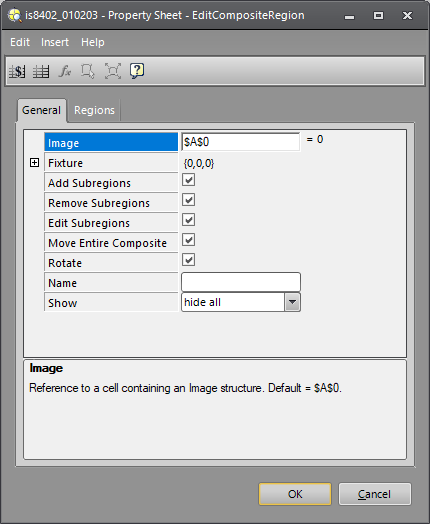
- Determine what actions should be allowed while in Interactive Graphics Mode (adding, removing and editing subregions, and moving and rotating the entire composite region) and enable or disable the appropriate checkboxes (Add Subregions, Remove Subregions, Edit Subregions, Move Entire Composite and Rotate).
- Optionally, specify a Name for the text label for the EditCompositeRegion control in the spreadsheet.
- Determine when overlay graphics should be displayed. To hide the overlay graphics, except when the cell containing the EditCompositeRegion function is highlighted in the spreadsheet, select hide all from the Show drop-down list. To always display the overlay graphics, choose input graphics only.
Regions Tab
-
By default, a Region is automatically included in the list of subregions. For this example, a Circle subregion will be used; highlight the Region and click the Remove button.
-
From the Insert drop-down list, select Circle to add a Circle subregion.
-
Click the Edit Graphics
 toolbar button to graphically adjust the subregion. Note: Alternately, highlight the subregion and manually enter the Circle Properties.
 -
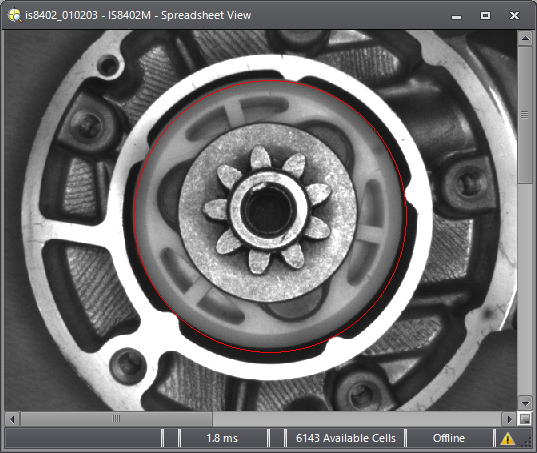
By default, the Circle is using an add operation. Adjust the Circle as necessary to cover the region of interest.
-
Right-click within the image area and click Add Subregion > Circle to add a second Circle subregion.
-
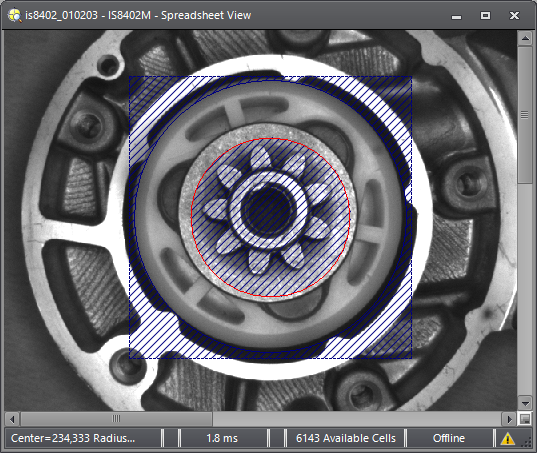
By default, the second Circle is using a subtract operation. Adjust the Circle as necessary to mask the portions of the image that should not be included in the inspection.
-
To accept the modifications, press ENTER. The graphic will appear over the image, but beneath the semitransparent spreadsheet. To cancel the modifications, press ESC. Once the changes are accepted, the new values will automatically be entered into the property sheet.
-
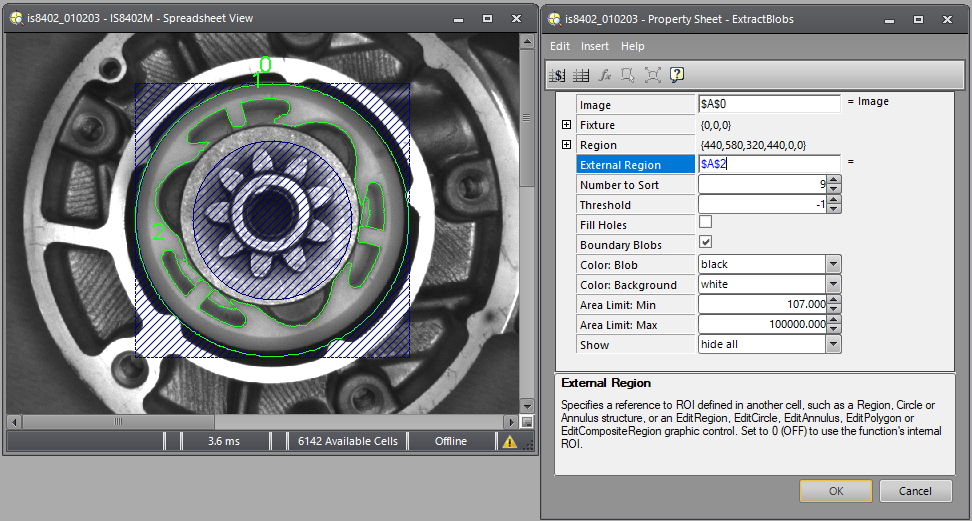
For this example, the ExtractBlobs function is used to perform a Blob analysis on the unmasked subregion. Insert the ExtractBlobs function into cell A4. For more information, see ExtractBlobs.
-
Configure the ExtractBlobs parameters. For the External Region parameter, specify cell A2, the cell containing the EditCompositeRegion function. The ExtractBlobs function then only locates Blobs found in the unmasked subregion.