GreyscaleDistance
Available for color In-Sight sensors and color-enabled emulators only, GreyscaleDistance converts each pixel of a color image or region of interest (ROI) to a greyscale value or to black and white based on a variety of user-set color parameters: color representation (red, green and blue, or hue, saturation and intensity) and user-entered values for RGB or HSI color and threshold. For more information, see Color Components of a Pixel. The greyscale image is derived from the Euclidean distance of the color of each pixel.
![]() More information on Euclidean
distance
More information on Euclidean
distance
 3, which is the square root of the number of components, and inverted to the greyscale spectrum, where 0 is black (no match) and 255 is white (exact match).
GreyscaleDistance Inputs
GreyscaleDistance(Image,Fixture.Row,Fixture.Column,Fixture.Theta,Region.X,Region.Y,Region.High,Region.Wide,Region.Angle,Color Representation,Color.Red/Hue,Color.Green/Saturation,Color.Blue/Intensity,Threshold.Red/Hue,Threshold.Green/Saturation,Threshold.Blue/Intensity,Show)
| Parameter | Description | ||||||||||
|---|---|---|---|---|---|---|---|---|---|---|---|
|
This argument must reference a spreadsheet cell that contains a valid color Image data structure. By default, the cell referenced is A0, which contains the Image data structure returned by AcquireImage. Note: AcquireImage is the only function that returns a
valid color Image
data structure.
|
|||||||||||
|
Defines the ROI relative to a Fixture input or the output of a Vision Tool function's image coordinate system. Setting the ROI relative to a fixture ensures that if the fixture is rotated or translated, the ROI will be rotated or translated in relation to the fixture. Note: The default setting is (0,0,0), the top leftmost
corner of the image.
|
|||||||||||
|
Also known as the region of interest or ROI, specifies the region of the image that undergoes image processing; creates a rectangular image region that can be transformed and rotated. For more information, see Interactive Graphics Mode. Tip: With this parameter
selected, clicking the Maximize
Region button will automatically stretch the region to cover the entire
image.
|
|||||||||||
|
Specifies which color representation to use for the color conversion.
|
|||||||||||
|
Specifies which color to use for the color conversion, depending on the color representation chosen. All three color values (and threshold levels) will affect the appearance of a pixel in the output image. For example, an RGB of 255-0-0 with all threethresholds set at -1 will display all "pure" red pixels as white in the output image, and all other colors as darker greyscale values, depending on their Euclidean distance from 255-0-0 (for example, white will appear dark).
|
|||||||||||
|
Specifies black-and-white ("binary") thresholds for each color coordinate, depending on the color representation chosen. Note:
|
|||||||||||
|
Specifies which graphical overlays are displayed on top of the image.
|
GreyscaleDistance Outputs
|
Returns |
An Image data structure containing the processed image, or #ERR if any of the input parameters are invalid. |
|
Results |
When GreyscaleDistance is initially inserted into a cell, a result table is created in the spreadsheet. |
GreyscaleDistance Vision Data Access Functions
The following Vision Data Access functions are automatically inserted into the spreadsheet to create the result table.
|
DarkCount |
GetDarkPixelCount(Image) |
The number of pixels below the binary threshold level. |
|
BrightCount |
GetBrightPixelCount(Image) |
The number of pixels equal to or above the binary threshold level. |
GreyscaleDistance Example
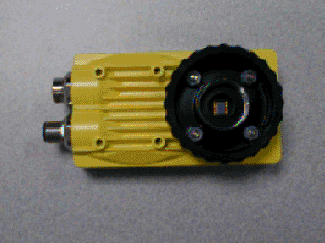
In this example, the object in the input image is a yellow Cognex vision system. Random samplings of the image (achieved by toggling off the Overlay view by clicking Overlay on the View menu, moving the cursor over the sensor and viewing the RGB information in the status bar in the bottom-left corner of the window) reveal RGB values of 205-185-124, 193-177-110, 175-154-39, 133-104-2 and 115-91-6 for the sensor.
This example uses a simple configuration of GreyscaleDistance that produces a greyscale output image.
After inserting the function into the In-Sight spreadsheet, the user defines the ROI by double-clicking on the word "Region" in the property sheet, which disappears to reveal the red ROI box overlaid on the image. The user moves or resizes the box using the cursor, and clicks the OK  button on the Job
Edit toolbar to confirm the selection and return to the property sheet. (The selection can also be confirmed by pressing the Enter key or by double-clicking within the ROI.)
button on the Job
Edit toolbar to confirm the selection and return to the property sheet. (The selection can also be confirmed by pressing the Enter key or by double-clicking within the ROI.)
Selecting RGB as the color representation, entering 205-185-124 in the RGB fields in the Color section of the property sheet, accepting the default settings of the other parameters and clicking OK in the property sheet completes the configuration for this example and applies the function to the input image.
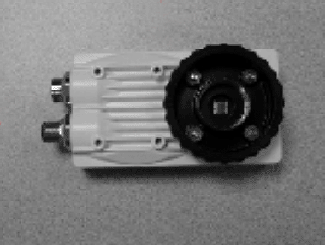
Below is the output image produced by GreyscaleDistance. Because the RGB values of 205-185-124 are an exact match of some areas of the sensor, the sensor is represented by very bright pixels.
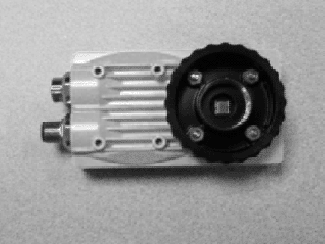
Compare the image above with the image below, which was produced by using the red filter in ColorToGreyscaleFilter. Although the sensor is bright in the below image, it lacks the increased contrast of the above image.