What is a Histogram?
The In-Sight Histogram tool performs histogram analysis by examining a ROI and classifying each individual pixel within it according to its greyscale value, and then placing them in a "bin" according to the pixel's greyscale value. In an 8-bit greyscale image, there are 256 bins, based on the number of possible greyscale values (0 to 255). Each bin contains a count of the number of pixels within it, with the bin being the index for the count. For example, if an image were to contain 46 pixels with a greyscale value of 33, the 33rd bin of the histogram for that region would contain the value 46. Additionally, the sum of the bins in the histogram array is always equal to the area of the region from which it was extracted.
The image below is a sample histogram chart from the ExtractHistogram function. The histogram chart displays the greyscale values of the pixels in the function's ROI.
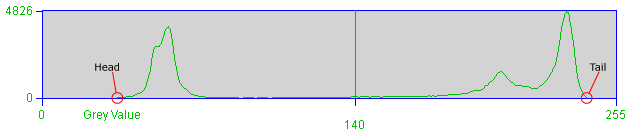
- The X-axis of the graph represents the total number of greyscale values (0 to 255).
- The Y-axis of the graph represents the number of pixels at a given greyscale value, and the scale is established by displaying the greyscale value with the greatest number of pixels.
- The green vertical line indicates the threshold.