Blob
In machine vision terminology, any two-dimensional, variably shaped and similarly shaded group of connected pixels can be referred to as a "blob." The process of extracting these blobs from an image, finding them in a region of interest and sorting them based on specific criteria is called blob analysis.
What is Blob Analysis
The In-Sight Blob Tool performs a type of blob analysis that is referred to as connectivity analysis, and this step is accomplished by using the DetectBlobs function. When the DetectBlobs function is inserted into the spreadsheet and its parameters configured, the function will begin performing the analysis by first segmenting the ROI.
During this process, the pixels in the ROI are divided into two categories, Blob and Background, based upon the greyscale threshold value. This threshold value separates the pixels so that those pixels below the threshold value are categorized as Black, and those values over the threshold are categorized as White.
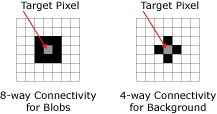
As this process is being performed, the pixels are examined to determine whether or not they are connected to their neighboring pixels. A Blob pixel is said to be connected to neighboring pixels if the Blob pixel touches another pixel of similar value to either side, above it, below it or diagonally to it. A Background pixel is said to be connected to neighboring pixels if the Background pixel touches another pixel of similar value to either side, above it or below it.

The figure below demonstrates how the In-Sight Blob Tool analyzes an image. In this example, a greyscale threshold value of 150 is used to segment the image into Blob and Background pixels. All pixels with greyscale values greater than or equal to 150 are categorized as White, or Background, pixels; while all pixels with values less than 150 are categorized as Black, or Blob, pixels:

Once the blob has been extracted from the image, DetectBlobs will automatically create a Blobs data structure and a result table that contains the data about the extracted blob. The information returned can be utilized by the FindBlobs and SortBlobs functions to filter and sort through other found blobs, based upon their physical characteristics and location, respectively.
The FindBlobs function analyzes the blobs within a ROI and determines whether or not the found blobs match the specified requirements; those blobs that meet the requirements will be returned, and scored in terms of how closely they match the requirements, in descending order.
The SortBlobs function analyzes the blobs within a ROI and determines where the blob is located in relation to a fixture; this is helpful in determining a blob's position relative to another blob, and a single DetectBlobs function can be used to find many blobs in a ROI at once.
When is Blob Analysis Used
It's best to use the In-Sight Blob Tools when the following conditions apply:
- The image is of a two-dimensional object.
- The image provides high contrast between light and dark pixels.
Why is Blob Analysis Used
When these conditions are met, blob analysis can be extremely useful in the following applications:
- Coarse gauging applications, such as measuring diameters or dimensions of squares to determine a part's width in a particular orientation.
- First-pass positioning applications, where the Blob Tools are used to quickly locate and place a rough fixture for another tool.
- Presence/absence applications where the Blob Tools are used to determine whether or not a blob is present or absent in the image.
- Counting applications, where the Blob Tools can be set up to count and sort blobs based upon characteristics such as their area or perimeter.
How to Perform Blob Analysis
With the In-Sight Blob Tools, the process of blob analysis can be broken down into three steps:
Step 1 – Examine the image and determine whether or not the image and its conditions meet the requirements for blob analysis.
Step 2 – Insert a DetectBlobs function into the spreadsheet and set the parameters accordingly to locate and identify the blobs in the image.
Step 3 – Insert a FindBlobs or SortBlobs function into the spreadsheet to filter the list of found blobs based on physical characteristics or the location of the blob, respectively.