ColorToGreyscaleFilter
Available for color In-Sight vision systems and color-enabled emulators only, ColorToGreyscaleFilter converts each pixel in a color image or Region of Interest (ROI) to a greyscale value based on a simple filter of eight available color parameters: "pure" red, green or blue (RGB); hue, saturation or intensity (HSI); luminance; or interpolation of the weighted average of RGB components.
ColorToGreyscaleFilter Inputs
| Parameter | Description | ||||||||||||||||
|---|---|---|---|---|---|---|---|---|---|---|---|---|---|---|---|---|---|
| Image |
This parameter must reference
a spreadsheet cell that contains a color Image data structure. By default, this parameter references A0, the cell containing the Image data structure returned by the |
||||||||||||||||
| Fixture |
Defines the Region of Interest (ROI) relative to a Fixture input or the output of a Vision Tool function's image coordinate system. Setting the ROI relative to a fixture ensures that if the fixture is rotated or translated, the ROI will be rotated or translated in relation to the fixture. The default setting is (0,0,0), the top leftmost corner of the image.
|
||||||||||||||||
| Region |
Also known as the Region of Interest (ROI), specifies the region of the image that undergoes image processing; creates a rectangular image region that can be transformed and rotated. With this parameter selected, by pressing the Maximize Region button on the property sheet's toolbar, the region will automatically be stretched to cover the entire image.
|
||||||||||||||||
|
Note: The Fixture and Region parameters must be defined within the bounds of the image; otherwise, the function will return #ERR.
|
|||||||||||||||||
| Conversion |
Specifies the type of the conversion filter. Note: Each color pixel is divided into color components (see the Color Components of a Pixel topic for more information).
|
||||||||||||||||
| Show |
Specifies the display mode for ColorToGreyscaleFilter graphical overlays on top of the image.
|
||||||||||||||||
ColorToGreyscaleFilter Outputs
| Returns |
An Image data structure containing the processed image, or #ERR if any of the input parameters are invalid. |
ColorToGreyscaleFilter Example
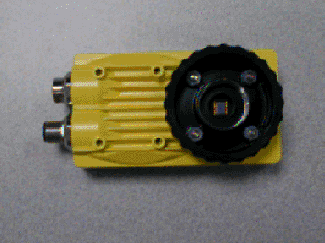
In this example, the object in the input image is a yellow Cognex sensor, which is also used in the example for GreyscaleDistance.
-
Perform random samplings on the image to check its RGB values. To do so, turn off the spreadsheet view with the
 (Show Grid) button or by pressing Shift + F6, and then start moving the cursor over the sensor. Notice the RGB information in the status bar in the bottom-left corner of the window as you move the cursor to reveal the RGB values of the acquired image.
In this example, the RGB values are roughly as follows at the colored areas of the sensor:

205-185-124 
193-177-110 
175-154-39 
133-104-2 
115-91-6 - After inserting the function into the In-Sight spreadsheet, you can define the ROI by double-clicking on the Region parameter in the property sheet, which then disappears to reveal the red rectangular image region overlaid on the image. Move and/or resize the box until it is properly placed, and double-click on it to confirm selection and return to the property sheet.
- Then, select a conversion filter, accept the default settings of the other parameters, and click OK in the property sheet. This completes the configuration for this example and applies the function to the input image.
-
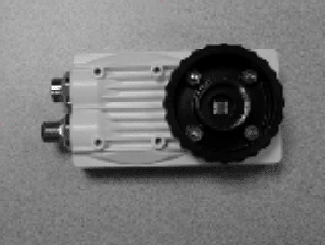
Below are three output images of the red, green and blue filters applied, respectively. As expected, the yellow parts of the sensor are the brightest in the red-filtered image because red is the strongest color component in the yellow sensor (the maximum red value for the image is 210, the mean is 116 and the median is 127.) The closer the input pixel value is to the filter's value, the brighter the output pixel.

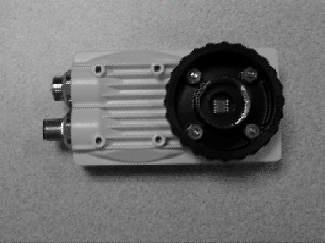
The yellow of the sensor is slightly darker in the green-filtered image because it contains less green (maximum of 199, mean of 112 and median of 125), compared to the red-filtered image.

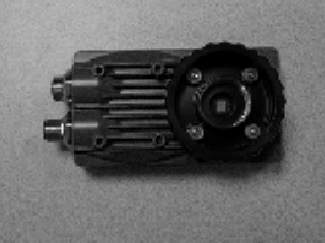
The yellow of the sensor is darkest in the blue-filtered image because it contains little blue (maximum of 197, mean of 101 and median of 121), compared to the red-filtered image.
