Red Analyze Tool – Statistics – Scores
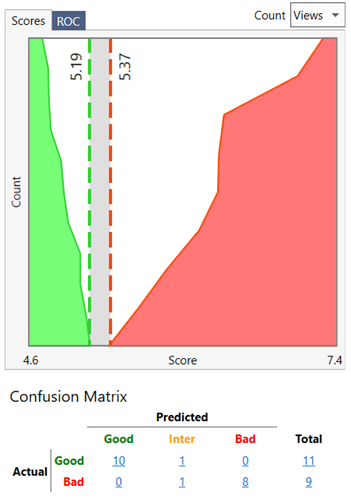
The Scores graph lists all images that were labeled and scored as well as the two thresholds (T1, T2) for the graph. The first threshold determines the maximum value a true negative (lacking a defect) can have before it is unsure about its value. The second threshold determines the minimum value a result must have before it is considered a true positive (contains a defect). Values in between are considered false positives or negatives depending on their label and will be assigned to the infer column of the confusion matrix.
Note: Both thresholds (T1 and T2, in the image below, T1 = 5.19 and T2 = 5.37) are interactive on the graph and can be adjusted. Adjusting these values interactively will also automatically update the Threshold parameter setting.