Processing Tool Parameters
The Processing parameters control the way that images are processed by the tool. Changing these parameters does not require the tool to be retrained; the effect can be seen right away by reprocessing the database.
- The Iterations, Simple Regions, Region Filter and Use Baseline parameters (used only with the Red Analyze Tool) are only available when Expert Mode is enabled.
- The Feature Filter parameter is only available for the Blue Locate Tool and Blue Read Tool, when Expert Mode is enabled.
| Parameter | Description | |||||||
|---|---|---|---|---|---|---|---|---|
|
Sampling Density |
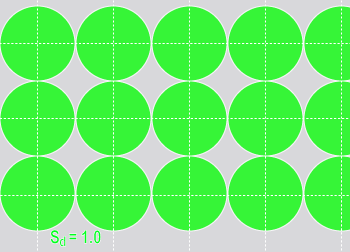
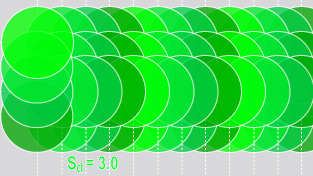
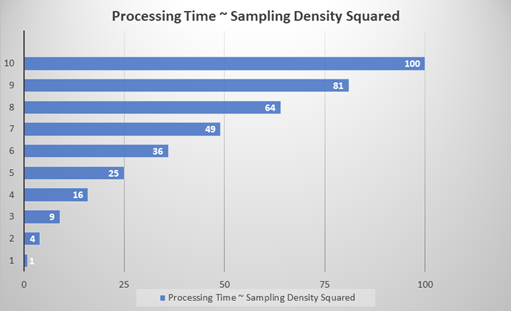
Specifies the density of sampling points with respect to the tool's Feature Size (FS) setting. The sampling density determines the degree of overlap between adjacent samples. A sampling rate of 1 means that the sampling location is incremented by the feature size between samples. The default sampling rate for most tools is 3, which means that the sampling location is incremented by one third of the feature size. Tip: One key aspect of the Sampling Density parameter is the relationship between the tool's processing time and accuracy. A tool's processing time depends approximately quadratically to the Sampling Density (Sd) value. For example, a Sampling Density setting of 1 is approximately nine times faster than a setting of 3 (n2). While higher Sampling Density settings are more accurate, it significantly impacts the processing time of the tool.
Note:
For the Green Classify tool, there is a fixed limit to the number of samples that can be processed for a single runtime image, which is 50,000. The number of samples is determined by the Feature Size, the image size, and the Sampling Density, as shown in the following equation:
If you have the Masking Mode parameter enabled, the sample count is reduced by the proportion of the pixels that are masked. When the combination of image size, Feature Size and Sampling Density settings exceeds the limit, the following error message may be displayed: Failed to process database sample 'image_file.name' (maximal number of samples exceeded, please reduce the sampling density, view size and/or feature size). In this event, consider options to reduce the number of pixels being processed, either through the use of a mask, focusing the ROI to specific areas or using a larger feature size setting. |
|||||||
|
Threshold |
This parameter is used by all of the tools.
|
|||||||
|
Precision |
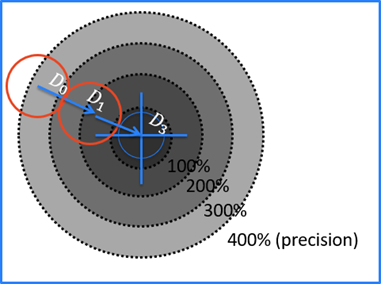
The Blue Locate tool includes a unique parameter, Precision, which refines the position of a feature iteratively. With each iteration, a new feature position is computed. The Precision parameter controls when this refinement is terminated. Feature position refinement is repeated until the difference between the current position and the new, refined position is less than the specified precision, multiplied by the Feature Size. For example, if you have a Feature Size of 40, and a Precision setting of 5%, the tool will stop searching for the position of the feature when the next jump would be less than 2 pixels (0.05 * 40 = 2 pixels).
|
|||||||
|
Feature Filter |
Specifies a filter for the Blue Locate and Blue Read tools, based on feature id, x, y, size and orientation, which is used as criteria for found features. By specifying a filter for features, features that do not match the filter will be removed from the results. If the parameter is left blank, all features will be returned. Since this filtering is done after the tool has processed the images, the features are not removed, simply hidden from the results. Features that are not present due to the filter will reappear, without reprocessing the image, by removing the filter criteria. Note: The syntax for filters is the same as that used for Display Filters. For more information about constructing the syntax for a filter, see the Custom Display Filters.
For example, if the Feature Filter parameter was set to the following:
|
|||||||
|
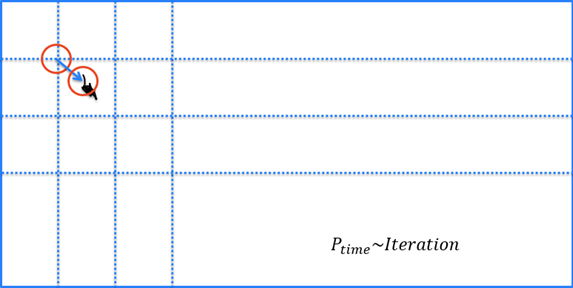
Iterations |
Specifies the number of times the Red Analyze tool will search locally to find stronger anomalies. In contrast to the Sampling Density parameter, processing time only depends linearly on the number of iterations.
|
|||||||
|
Simple Regions |
Specifies that the Red Analyze tool should only extract only "simple regions", i.e. polygons without holes. |
|||||||
|
Region Filter |
Specifies a filter for the Red Analyze tool to be used as criteria for found regions. By specifying a filter, regions that do not match the filter will be removed from the results. If the parameter is left blank, all regions will be returned. Note: The syntax for filters is the same as that used for Display Filters. For more information about constructing the syntax for a filter, see the Custom Display Filters.
The available region properties are:
|
|||||||
|
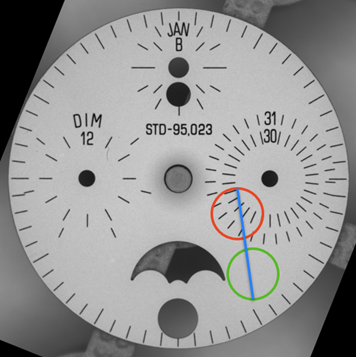
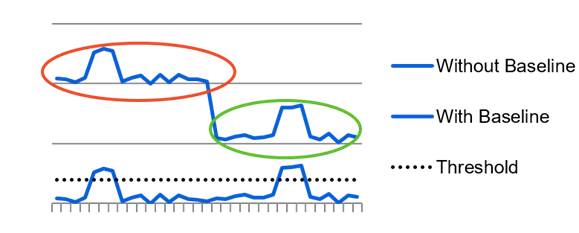
Use Baseline |
Specifies whether or not the Red Analyze tool should use a weight on the scoring on the different regions of the image, depending on the variation over this region, measured in all images. This parameter will lower the response with the average noise level. This is useful when the view contains multiple distinctive structured areas.
|
|||||||