Red Analyze Tool – Statistics – Scores
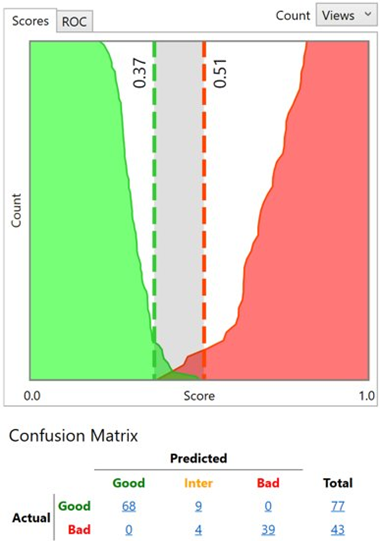
The Scores graph lists all images that were labeled and scored as well as the two thresholds (T1, T2) for the graph. The first threshold determines the maximum value a True Negative (truly lacking a defect) can have before it is unsure about its value. The second threshold determines the minimum value a result must have before it is considered a True Positive (truly containing a defect). Values in between are considered False Positives or False Negatives, depending on their label, and will be assigned to the Inter column of the confusion matrix.
-
Using both the T1 and T2 thresholds can create an Inter (or marginal) class. If you encounter this, you can set up a process to flag Inter any images for a human inspector to review, or those images can be saved for further re-training (while offline). As a another fail-safe, images in that category could be rejected and sent to a re-work bin.
-
Both thresholds (T1 and T2, in the image below, T1 = 0.37 and T2 = 0.51) are interactive on the graph and can be adjusted. Adjusting these values interactively will also automatically update the Threshold parameter setting.
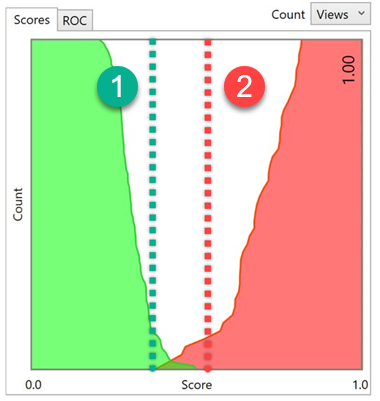
- Setting the Threshold here makes the tool “less picky” about what it predicts as a defect, generating more False Positives.
- Setting the Threshold here makes the tool “more picky” about what it predicts as a defect, generating more False Negatives.