Question
How to Analyze Encoder Signals Using the GetEncoderStats Function
Answer
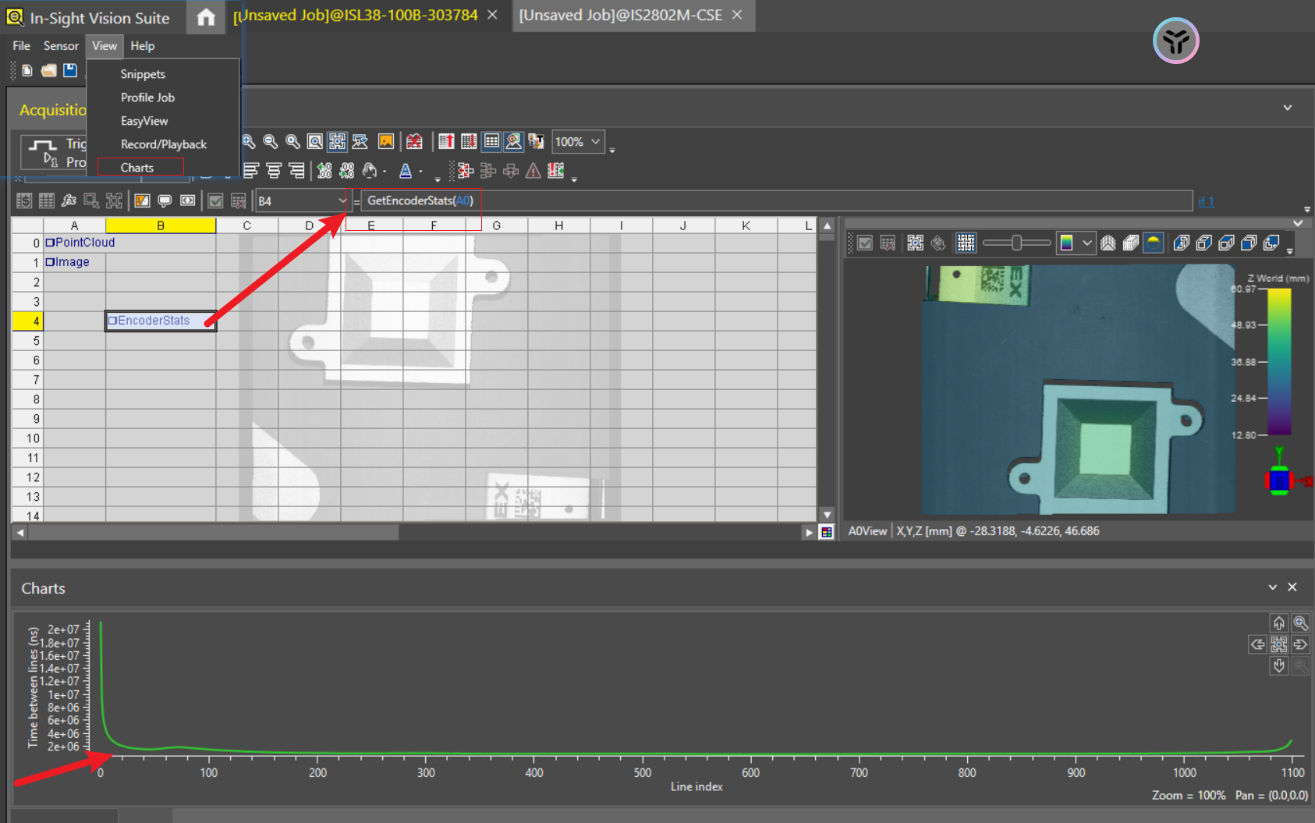
GetEncoderStats: Returns a chart of the time intervals between consecutive profiles in the point cloud. The time intervals are measured in milliseconds. Use this function when the vision system is in encoder mode to detect encoder signal issues. If motion speed is constant but the graph shows anomalies, the encoder signal might be noisy or unstable.
Procedure:
Open the View menu and select Charts.
Enter the GetEncoderStats function.
Trigger the camera to capture a 3D point cloud image.
Note: The function returns no data when loading point clouds acquired with In-Sight 3D Spreadsheet version 25.1.0 or earlier.
Example 1: Slowing and Accelerating Motion
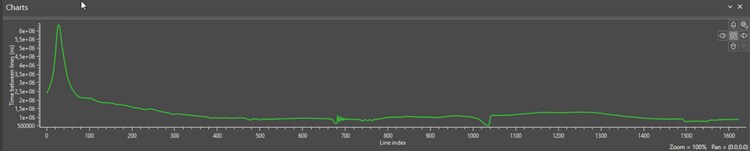
The following example shows a slowdown at the beginning of the point cloud acquisition. The increased time between profiles indicates reduced motion speed.
Anomalies appear near profile 700, followed by an acceleration around profile 1000, which decreases the time between profiles.
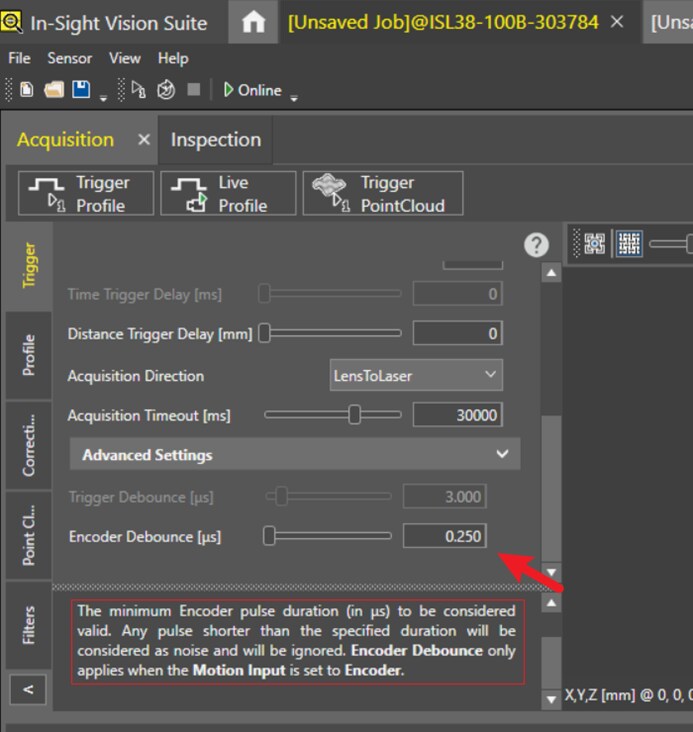
- Related Setting: Encoder Debounce
The minimum encoder pulse duration (in μs) to be considered valid. Any pulse shorter than the specified duration is considered noise and will be ignored. This setting is only available if you have set Motion Input for Encoder. If your run time is generally consistent, but there is a large difference between the average and the maximum frame rates, it is possible that there is noise in the encoder signal. In such cases, try increasing Encoder Debounce to stabilize performance.