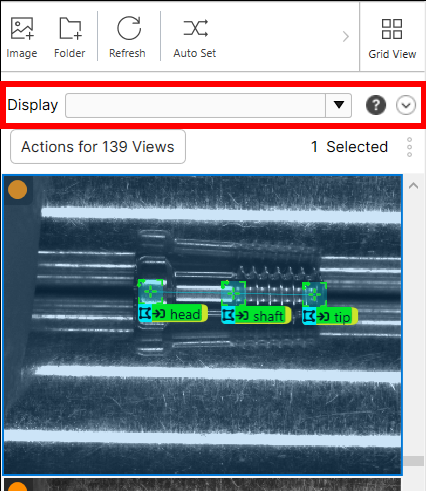
Display Filters
The Display field of the View Browser is used to filter Views, based on either the default drop-down menu items in the View Browser, or custom filters that you create using keywords, conditions, logical operators, variables or Regular Expressions. The Display filters are helpful when labeling views and validating results, allowing you to operate on selected Views based on your specified criteria.
Default Display Filters
A set of general and common selection filters are available in the View Browser for the different tools. These filters are listed in the following table and are available in the drop-down menu of the Display field.
| Filter | Description |
|---|---|
|
all |
Returns all of the Views in the database. |
|
new |
Returns newly imported images. |
|
labeled |
Returns labeled Views.
|
|
not labeled |
Returns Views that have not been labeled. |
|
trained |
Returns Views that were used for training. |
|
not trained |
Returns Views that were not used for training. |
In addition, depending on the Deep Learning tool that is selected, there are also tool-specific filters available for each of the tools.
| Tool | Filter | Description |
|---|---|---|
|
Red Analyze |
good bad |
Returns Views labeled as good. Returns Views labeled as bad. |
|
Green Classify |
unknown mismatch |
Returns Views that contain an unknown tag and/or class. Returns Views where the predicted tag and/or class does not match the actual class |
| Red Analyze High Detail
Green Classify High Detail |
validated not validated |
Returns only the Views that are included in the validation set. Returns only the Views that are not included in the validation set. |
|
Blue Locate Blue Read |
no matches |
Returns Views where no Models were found (provided that a Model had been defined). |
Custom Display Filters
Custom filters can be specified by using specific keywords, logical operators, variables, methods, and/or operators and conditions. You can also construct custom filters through the use of Regular Expressions.
When constructing your custom filter, your filter should be constructed such that it evaluates to a Boolean result.
Display Filter Keywords
When creating custom filters, you can start with the keywords in the in the Display drop-down menu, and then add logical operators and variables.
In addition to the Display drop-down menu keywords, the following keywords can be used by typing them in the Display field:
- positive: Used with the Red Analyze tool, returns Views that have defects.
- negative: Used with the Red Analyze tool, returns Views that do not have defects.
- 'filename_word': Returns Views that have filenames which contain a word. For example, if you had curated images in your Training Set that were named "bad_head_001.png", "bad_head_002.png", etc. To return only the Views that contained the word "bad_head" in the filename, you would enter 'bad_head' into the Display field.
Display Filter Logical Operators
Keywords (and conditions) can be used in conjunction with logical operators to build custom selection filters. The three basic logical operators, not, and, or, are available to construct custom filters.
| Example | Description |
|---|---|
|
not trained |
Returns Views that are not used for training. |
|
good and not 'good' |
Returns Views labeled as good and whose image filename does not contain the word 'good'. |
|
labeled or not manual |
Returns Views that are labeled and/or whose training flag is set to Auto. |
Display Filter Variables
Variables, methods, and basic mathematical comparison operators (=, >, <,...) can be used to construct special conditions in order to select a particular set of Views. The available variables for each of the three tools are summarized in the following tables.
-
All Tools
Variable Description random
Generates a random variable in the interval [0,1] for each View.
-
Red Analyze Tool
Variable Description score
Returns the overall score of the Views (highest region score).
T1,T2
Returns the lower (T1) and higher (T2) thresholds (displayed in the Scores graph and the Threshold parameter).
region/score
Returns the scores of the defective regions found by the system. This variable potentially returns a list of values (see the Notes section below for more information).
region/area
Returns the area of the defective regions.
region/x
Returns the horizontal position of the defective regions.
region/y
Returns the vertical position of the defective regions.
region!/(score│area│x│y)
Returns the score, area, horizontal or vertical values of labeled regions.
background/score
Returns the background scores, in other words, scores that are outside of the defective regions.
-
Green Classify Tool
Variable Description tag/score
Returns the probability scores of each tag/class. This variable returns a list of values (see the Notes section below for more information).
tag[Tag_Name]/score
Returns the predicted probability score pertaining to the class "Tag_Name".
tag![Tag_Name]
Returns True for Views labeled with the tag/class "Tag_Name". This variable can also be used to select Views labeled with the tag "Tag_Name".
tag!/score
Returns the probability score of the correct (labeled) class.
tag![Tag_Name]/score
Returns the probability score of the correct class, selecting only Views labeled with the tag/class "Tag_Name".
-
Blue Locate and Blue Read Tools
Variable Description feature
Returns one or more found features in the View, and displays a thumbnail of the feature(s).
feature[0]
or
feature[0,1]
Returns Views where the specified feature (0) is found (if used as a single statement, otherwise the list of found features; see the Notes section below for more information).
feature![0]
or
feature![0,1,2]
Returns the same as above, except only for the specified feature that was labeled.
feature[0]/score
Returns the probability scores for features marked (predicted) as 0.
feature[0]/x
Returns the horizontal position of the feature 0.
feature[0]/y
Returns the vertical position of the feature 0.
feature![0]/(score│x│y)
Returns the score, horizontal or vertical position for the labeled feature 0.
match
Returns True if a model was found, or a list of found models (see the Notes section below for more information).
match[Model1]
Returns the same as above, but only if Model1 was found.
match![Model1]
Returns the same as above, but for a model found among the labeled features.
match[Model1]/score
Returns the scores of the found model (Model1).
This variable can potentially return a list of values; see the Notes section below for more information.
match[Model1]/angle
Returns the angles of the found models.
match[Model1]/scale
Returns the scales of the found models.
match[Model1]/schear
Returns the shearing of the found models.
match[Model1]/x
Returns the horizontal positions of the found models.
match[Model1]/y
Returns the vertical positions of the found models.
match![Model1]/(score│angle│scale│shear│x│y)
Returns the same as above, but for a model with labeled features.
match/features
Returns the number of marked features in any model matched by the system (potentially returns a list of values; see the Notes section below for more information).
match[Model1]/features
Same as above, but for specific model Model1.
match!/features
Number of features of any model matched among labeled features.
match![Model1]/features
Same as above, but for specific model Model1.
Some variables might return a list of values (whenever there are many possible values as an output). Some properties (the number of elements, the maximum or the minimum) of such returned lists can be extracted with the methods described below.
| Tool | Example | Remark |
|---|---|---|
|
Red Analyze |
region/(score│area│x│y) |
Returns a list of scores, with each value corresponding to one found region. A probability score always lies in the interval of [0,1]. The Red Analyze tool returns a probability score only when used in Supervised mode (for example the probability of a region to be defective). |
|
Green Classify |
tag/score |
Returns the list of probabilities for each class. A probability score always lies in the interval of [0,1]. In addition, the list of values returned by tag/score add up to 1. |
|
Blue Locate Blue Read |
feature, match |
Returns true as a single statement, otherwise will return a list of found features or models. |
|
feature![0]/(score│x│y) |
Returns the scores, horizontal or vertical positions of the labeled feature 0. |
|
|
match[Model1]/(score│angle│scale│shear│x│y) |
Returns the list of scores, angles, scale, shear, horizontal or vertical positions of any found model (Model1). |
Display Filter Methods
A few methods are available to access some properties of lists of values, as returned by some variables.
| Method | Description |
|---|---|
|
count() |
Returns the number of items in a list. |
|
max() |
Returns the maximum in a list. |
|
min() |
Returns the minimum in a list. |
Display Filter Operators and Conditions
Basic mathematical comparison operators can be used in conjunction with variables to construct filtering conditions.
| Symbol | Example | Description |
|---|---|---|
|
= |
count(feature![h])=3 |
Returns Views with exactly 3 features with a label ID of "h". |
|
!= |
count(match)!=0 |
Returns Views where the number of found models is not equal to 0. |
|
< > |
feature[t]/score>0.9 |
Returns Views where the feature "t" is found, and has a probability score greater than 90%. |
|
<= |
min(region/x)<=50 |
Returns Views whose leftmost defective region is located, at most, 50 pixels away from the left image border. |
|
>= |
random>=0.8 |
Returns approximately 80% of the Views. |
|
in |
not score in [0.28,0.43] |
Returns Views whose score lies outside the [0.28,0.43] interval (where 0.28 = threshold 1, and 0.43 = threshold 2). |
Display Filter and Sorting Examples
The topics in this section provide examples that illustrate various filtering criteria for the Cognex Deep Learning Tools.
Blue Locate Tool Filter Examples
The following examples illustrate common Display filters to use with the Blue Locate Tool:
| Display Filter | Description |
|---|---|
|
count(match)=0 |
This filter corresponds to the no matches option in the Display drop-down menu. Only views which do not contain matched models will be displayed. |
|
count(feature[t]/x in [500,600]) > 0 and count(feature[t]/y in [300,400]) > 0 |
Returns Views where at least one feature (ID = t) is found in the specified ranges of horizontal and vertical positions. |
|
count(match[Model1]/scale in [0.9,1])>0 and count(match[Model1]/angle in [0,90]) > 0 |
Returns Views where at least one model (Model name = Model1) is found, among marked features, and has its scale and orientation angle in the specified range of values. |
|
match[Model1]/features<5 |
Returns Views where the model (Model name = Model1) is found and matched with less than 5 marked. |
|
features.min(match/features)=2 |
Returns Views where the minimal number of features used to match any of the models is exactly 2. |
|
min(feature[h]/x) > 500 |
Returns Views where the leftmost feature (h is located at least 500 pixels away from the left image border). |
Green Classify Tool Filter Examples
The following examples illustrate common Display filters to use with the Green Classify Tool:
| Display Filter | Description |
|---|---|
|
tag!/score < max(tag/score) or score < threshold tag!/score < score or score < threshold |
These filters actually correspond to the display filter mismatch from the drop-down menu, whenever threshold is the processing threshold. It filters views for which the actual class (the given tag) probability is lower than the maximal probability among all classes (score is equivalent to max(tag/score)); in other words, the wrong tag/class is predicted, as well as views for which the maximal probability score is lower than the processing threshold, in other words, no tag/class is predicted. |
|
not trained and tag![cat] and tag[dog]/score = max(tag/score) not trained and tag![cat] and tag[dog]/score = score |
Filters views that were not used for training, that are labeled with the tag cat, but for which the tag dog is predicted. |
Red Analyze Tool Filter Examples
The following examples illustrate common Display filters to use with the Red Analyze Tool:
| Display Filter | Description |
|---|---|
|
bad and count(region!/score > T2) <= 2 |
Returns views labeled as bad, which have two or less labeled defective regions with a score higher than the upper threshold (T2). |
|
count(region) > 1 and max(region/area) < 200 |
Returns views with more than one marked (found by the system) defective region and the largest defect area smaller than 200 pixels. |
|
count(region/x in [100,200]) >= 2 |
Returns views with at least two defective regions, whose center is located in the specified range of horizontal positions. |
Display Filters Using Regular Expressions
You can also create more complex filters by using Regular Expressions (aka regex or regexp). For example, if you wanted to filter images based on their filename ending in “01.png”, “02.png” or “03.png”, you could use the following regular expression: /0[1-3].png$/.test(filename) In this example, "filename" is a keyword, and is used, as is. The following table provides some basics for using Regular Expressions within the VisionPro Deep Learning GUI.
|
Anchors |
|
|
^ |
Specifies the start of a string or a line, such as ^0, would match strings that start with a 0. Note: When the ^ character is used inside brackets, in other words, [^0], the ^ means does not start.
|
|
$ |
Specifies the end of a string or a line, such as 0$, would match strings that end with a 0. |
|
Basic Matching |
|
|
. |
Matches any single character. Note: To match a period, you must escape the dot by using a backslash. For example, you would enter: \.
|
|
\d |
Matches any digit in the 0123456789 range. The actual digits, 0-9, can also be expressed by typing the digit. |
|
\w |
Matches any letter, digit and the underscore character (_). The actual characters, which are case sensitive, can be expressed by typing a character a-z or A-Z. |
|
\s |
Matches a whitespace. |
|
Specific Characters |
|
|
[...] |
The square brackets [ ] are used to match specific characters, which are defined within the square brackets. For example, [a-z] matches one lowercase letter from a to z, or T[ao]p would match either Tap or Top. The brackets can be used in compound structures, such as [A-C][0-3][g-i], so that you would match strings of A0g, A0h, B1i, and C3g. |
|
Repetitions |
|
| {...} | The curly braces { } are used to denote repetitions. For example, t{2} returns two t's; [def]{3} returns three characters, which could be a d, e or an f; and .{1,4} matches between one and four of any character. |
|
* |
Denotes zero or more instance of a character or a digit. For example, a* would match zero or more a character(s). |
|
+ |
Denotes one or more instance of a character. For example, [nop]+ would match one or more of the n, o, or p characters. |
|
Optional Characters |
|
|
? |
The question mark "?" is used to match either zero or one of the preceding character or group. For example, 12?3 will match either 123 or 13. Note: To match a question mark, you must escape the question mark by using a slash. For example, you would enter: \?
|
|
Grouping |
|
|
(...) |
The parentheses are used to define groups of characters, so that the sub-pattern within a pair of parentheses constitutes a group. This can be very useful in extracting information from image filenames. For example, if you had curated your images to use a certain naming convention, like Good_0001.png, and you wanted to only return those images, you could use ^(Good.+)\.png$ You can also use the parentheses to capture nested groups. Using the example above, you could refine the search based on the digits, such as ^(Good(\d+))\.png$ Also, the quantifiers described above can also be used within parentheses to capture patterns. For example, if you wanted to capture possible areas greater than 1000, you could use (\d{4})x(\d{4}) The logical OR identifier | can be used to denote different possible sets of characters. For example, if you wanted to return "scratch", "dent" or "hole" in a set of filenames, you could use ^(Bad(\d+)(scratch|dent|hole))\.png$ |