Create Feature Label (Feature Labeling)
Labels are the user-generated input data that establish the ground truth for the tool. Ground truth refers to the undisputed facts about the images in your application, in other words, what you, as the human determine to be the key information within the image (feature, character, defect, class). Labels establish the ground truth, which is used for both training and performance analysis. So it is imperative that you label accurately.
What is Labeling
Since the Deep Learning software is based on learning, what the network is taught about the images is vitally important. Within the Deep Learning parlance, this process is termed “labeling.” Labeling is the process of a user identifying features or defects, and graphically illustrating them on the image. The label represents the ground truth for the tools and is used to train the tools and validate their performance.
The label is the ground truth for the tool, in other words, you are telling the tool, "this is what it should learn." The most important part of programming the tools is ensuring that the images that are being used for training are completely and accurately labeled. Without knowing the ground truth data for the images, you cannot tell whether the tool is working properly or not. Also, without accurate labeling, the tool's training will not work as well.
When you are evaluating the performance of your tools and application, performance is always measured against the labeling that you provide. If your labeling does not reflect the actual ground truth for your images, then accurate and repeatable tool performance will not mean anything. When you train the Deep Learning tools, the goal for training – the cost function – is attempting to train the tool to produce a response that precisely matches the labeling that you provide.
For each of the tools, labeling is a manual operation (see below for the specifics of how labeling is performed for each tool). The most important characteristic of good labeling is that it is consistent, both between images and between observers and people performing the labeling. If you provide an image set to multiple people to label, and their labels do not agree, then the tool will likely not work well.
For each tool, there is a slightly different process, but the principle is the same. Once Labeling is completed, you will be ready to train the tool, and examine the Markings that the tool provides. You can toggle the display of labels and markings by either using the Alt + Left arrow and Alt + Right arrow keys, or from the right-click menu in the image.
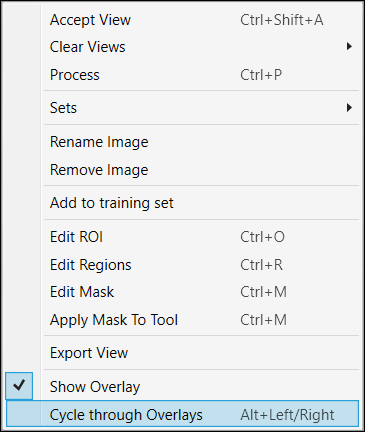
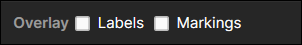
You can also show overlay with enabling the "Label" at the Overlay Checkbox.
Labeling in Blue Locate
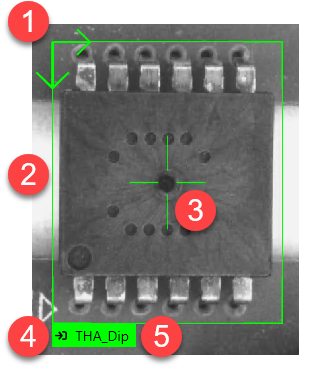
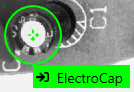
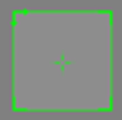
The Blue Locate tool locates and identifies features in an image. The Blue Locate tool labeling process involves identifying the locations and names of features in an image. Within the image, you label features by identifying the center of the feature, and placing a feature label graphic over the feature. If orientation and/or scaling is enabled, then you can also specify an orientation or scale. You specify the name of a feature using up to 140 characters.
|
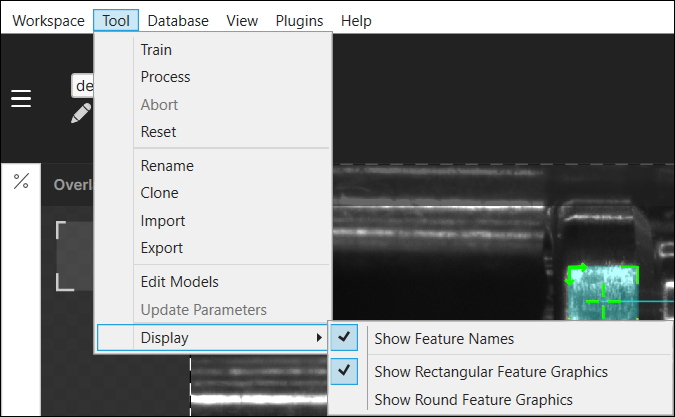
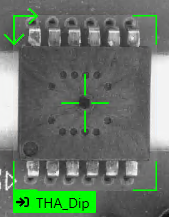
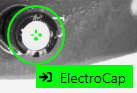
Note: This illustration shows the rectangular feature graphic. You can also use circular feature graphics. This can be changed by selecting the desired feature graphic geometry from the Tool > Display menu. For more information, see Circle or Rectangle Feature Labels topic.
|
|
| Graphic | Description |
|
1 |
Indicates the orientation of the feature graphic. The Oriented checkbox must be enabled to be able to change the orientation of the feature graphic. When the display is switched to a circular feature graphic, the orientation is indicated in the middle of the circular graphic. |
|
2 |
The bounds of the feature. |
|
3 |
The center of the feature. |
|
4 |
Along with the color, indicates the state of the feature graphic. |
|
5 |
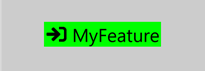
The 140 character name of the feature graphic. |
Once you have applied labels to the features in your images, and you have trained the tool, the tool will apply Markings to the areas of the image that it thinks match the feature. The difference between labels and markings is their appearance.
The three key components of labeling features for the Blue Locate tool are accurately placing, sizing the label graphics, and assigning useful names to the features.
Placing the Labels
You perform Labeling with the Blue Locate tool by using your mouse and clicking on the features you want to identify, which places a feature label graphic as an overlay on the feature in the image. Deep Learning will perform the best when the center point of the feature label graphic is placed on an interesting feature where there is a lot of information on it. A good example is to place the feature label graphic on an intersection of some edges, rather than a random point on a single edge.
Sizing the Labels
The label sizing is determined by the Feature Size parameter, and whether or not the Scaled parameter is enabled. See the Sizing the Labels: Feature Size (Sampling Parameter) and Scaled (Feature Parameter) topics for more information.
Naming the Labels
Once you have clicked on the feature, the feature label graphic will be displayed, and you will need to assign a name to the feature. The name can be up to 140 Unicode characters.
There are two ways to assign a name to a feature label graphic:
- Click on the feature, and when the editing cursor appears, you can either type in the name, or paste in a name, up to 140 characters long.
- In the Database Overview, select the text for the feature and press the pencil icon to either type or paste in the name.
After adding a name, press the Enter key.
Labeling Multiple Features
To speed up the labeling process, the Deep Learning software will remember the last created label. This provides you with a couple of different options, depending on the features that you are labeling.
- If you have a minimal number of features to label in your images, after placing the label in the first image, go through the rest of your images and place that label in all of the subsequent images before creating a new feature label graphic. Then repeat this process for all of the features you need to label in your images.
-
If you have a lot of small features to label in your images, label one feature, and then label each instance of that feature, repeating this process for each feature.
Labeling Multiple Features with "Copy + Paste"
After you have applied labels to features in an image, you can also hold down the Shift key and drag your mouse to select multiple features (or hold down the Shift key and select the desired features). Once you have selected the features, you can copy them using the standard Copy + Paste keyboard shortcuts (Ctrl + C and Ctrl + V) or right-click menu options.
Circle or Rectangle Feature Labels
For Blue Locate, you can display feature label graphics as either a rectangle or a circular shape. When your application contains square or rectangular features, the rectangular feature graphic should be used. If your application contains circular or elliptical features, then the circular feature graphic should be used.
To change the display of the feature label graphics, go to the Tool menu and open the Display sub-menu.
Rectangular Feature Graphic
Circular Feature Graphic
Feature Label Graphics
This topic provides an overview of the feature label graphic, the states of the labels used by the Blue Locate tool.
| Labeled Feature |
|---|
|
|
| Unselected | Selected | |
|---|---|---|
|
Label feature graphic |
|
|
Sizing the Labels: Feature Size (Sampling Parameter) and Scaled (Feature Parameter)
The configuration of the Blue Locate tool's Feature Size is dependent on the Features Tool Parameters settings.
-
If your application revolves around a single feature or multiple features that are all of the same size and aspect-ratio, then you may configure the size and aspect ratio of the feature independently to match the size of the feature(s) in the images, by either using the interactive control or the Feature Size field. All of your feature labels will be exactly the size and shape of the feature size that you specify.
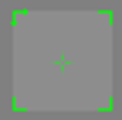
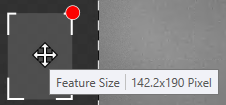
The tool's interactive Feature Size indicator graphic is displayed in the bottom left corner of the image (shown below).

The indicator graphic can be dragged within the image, allowing you to size it based on the feature(s) in the image. In addition, the indicator can be re-sized by dragging the re-size handle (which is displayed when hovering over the indicator). Changing the size of the indicator will also change the Feature Size parameter.
-
If your application involves features that are of differing sizes and/or aspect-ratios, you will want to enable the Scaled parameter.
- Set the Scaled parameter to Uniform when the sizes of individual feature labels can be set differently, but all of the aspect ratios are the same.
- Set the Scaled parameter to Non-uniform when each feature has a unique aspect ratio.
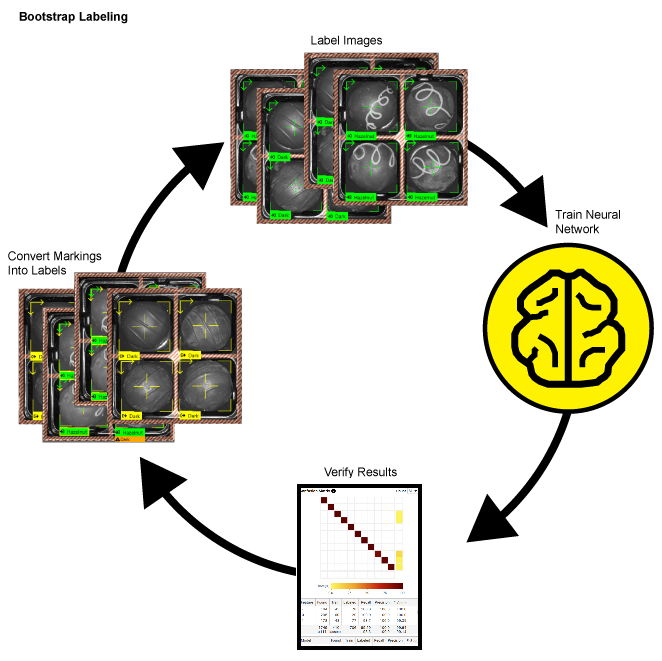
How to Label Fast: Bootstrap Labeling
You can consider using the bootstrap method of labeling your images to speed up the labeling process for each tool. "Bootstrap" labeling refers to the process of beginning your labeling process by just labeling a small sample size of your images, then training the tool, and reviewing the results by accepting views with correct markings to convert them into labels, and removing incorrect markings and replacing them with correct labels. You can speed up this process further by dividing images into multiple views and only labeling a single view. In addition, you can also temporarily reduce the Epoch Count in Training parameters, which will make the training time shorter.
- Label a few images in your Training Set.
- Train the tool.
- Review the images and results.
- Accept the views where the tool's markings are accurate (right-click and select Accept View, or Ctrl + Shift + A). This will change the marking into a label. For the Red Analyze tool in Supervised mode, you may have to edit the defect region. For markings that are inaccurate, clear the markings from the image (right-click and select Clear Marking, or Ctrl + C), and then add the correct label.