Region Area Metrics
In order to better understand the results being returned by the Red Analyze tool in Supervised modes (Red Analyze Focused Supervised, Red Analyze High Detail), you will need to know how to interpret the Recall, Precision and Thresholds used by the tool. They are intertwined, and the Thresholds will affect both Recall and Precision.
- Recall is the percentage of the total labeled defect region which is covered by a marked (aka found) defect, across all of the labeled images being processed.
-
Precision is the percentage of the total marked defect region which is covered by the labeled defect region, across all of the labeled images being processed.
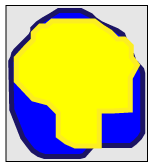
Labeled Defect Region
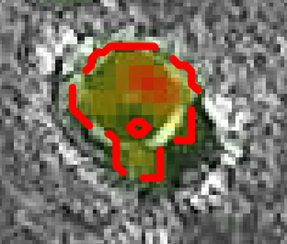
Marked Defect Region
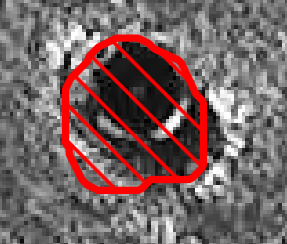
Label
Marking


- Recall in this scenario is 60% (40% of the labeled defect is missing from the marked defect), and Precision is 99%, since almost all of the marked defect is covered by the labeled defect.
There are two Threshold parameters (which can be adjusted graphically in the Database Overview), T1 and T2.
- The lower threshold (T1) is the score above which a defect pixel is included in a defect region. The lower the threshold setting, the larger the defect region.
-
The upper threshold (T2) simply determines the score at which an image is marked as Bad. Adjusting this threshold affects the ROC and Confusion Matrix, but not Precision and Recall.
Threshold T1 = 0.10
Threshold T1 = 0.50
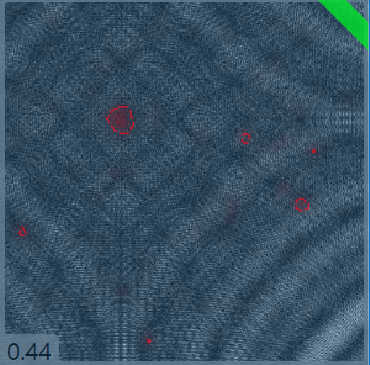
As shown above, adjusting the T1 threshold will immediately affect both Recall and Precision. As the T1 threshold increases, the marked defect gets smaller. This will decrease the amount of labeled defect region with corresponding defects, reducing the Recall score. At the same time, the Precision will improve because the smaller marked defect regions are more likely to be completely covered by the labeled defect regions.