ViDi
The ViDi function allows you to construct a deep learning-based vision solution using the Blue Locate, Blue Read, Red Analyze, and Green Classify tools as described in Cognex ViDi Tools.
Press the Open ViDi Editor button to open a separate tab where you can configure, edit and train your Cognex ViDi Tools.
To use the ViDiCheck function:
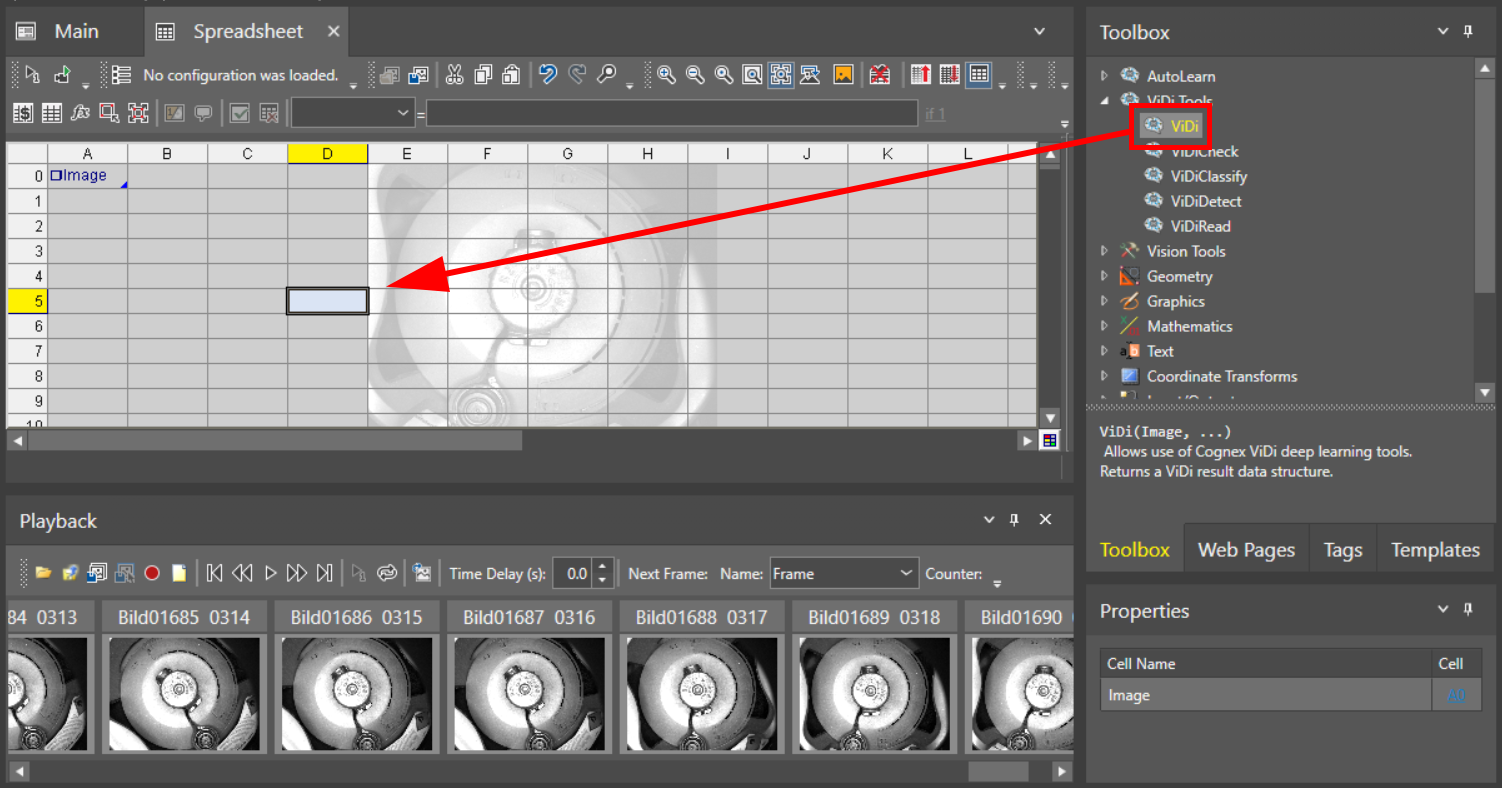
- Select the ViDiCheck tool from the ViDi Tools dropdown in the Toolbox.
-
Drag and drop the VidiCheck tool to the desired cell of the Spreadsheet.
-
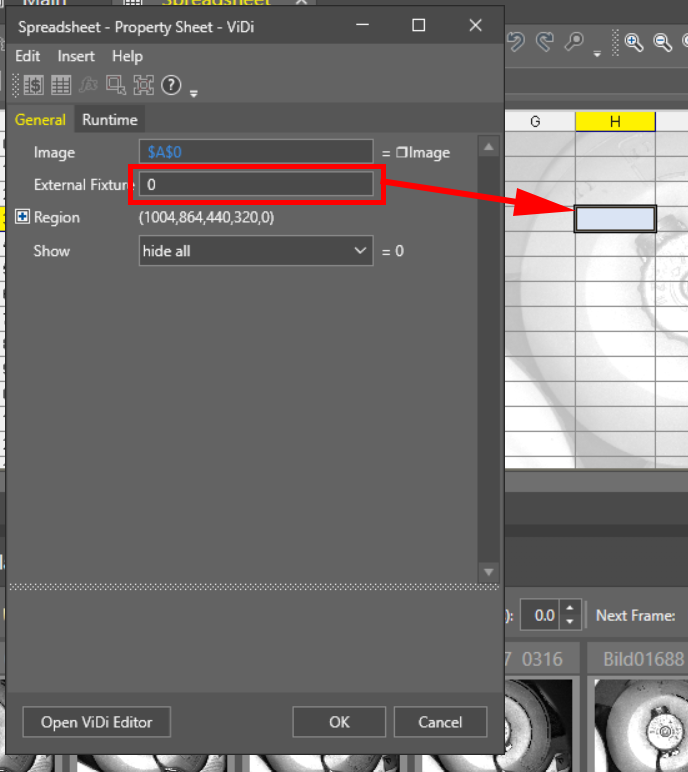
Set External Fixture in the Property Sheet that automatically opens:
- Set to 0 if you do not want to use an external fixture.
- Specify a fixture defined in another cell by clicking in the External Fixture text box, and then clicking on the cell in Spreadsheet, or by manually entering the cell reference.
-
Set Region in the Property Sheet:
- Define the X and Y offset from the Fixture origin and the region width and height in pixels, and the rotation of the region compared to the Fixture X axis in degrees.
- Alternatively, double-click on Region and visually edit the region of interest.
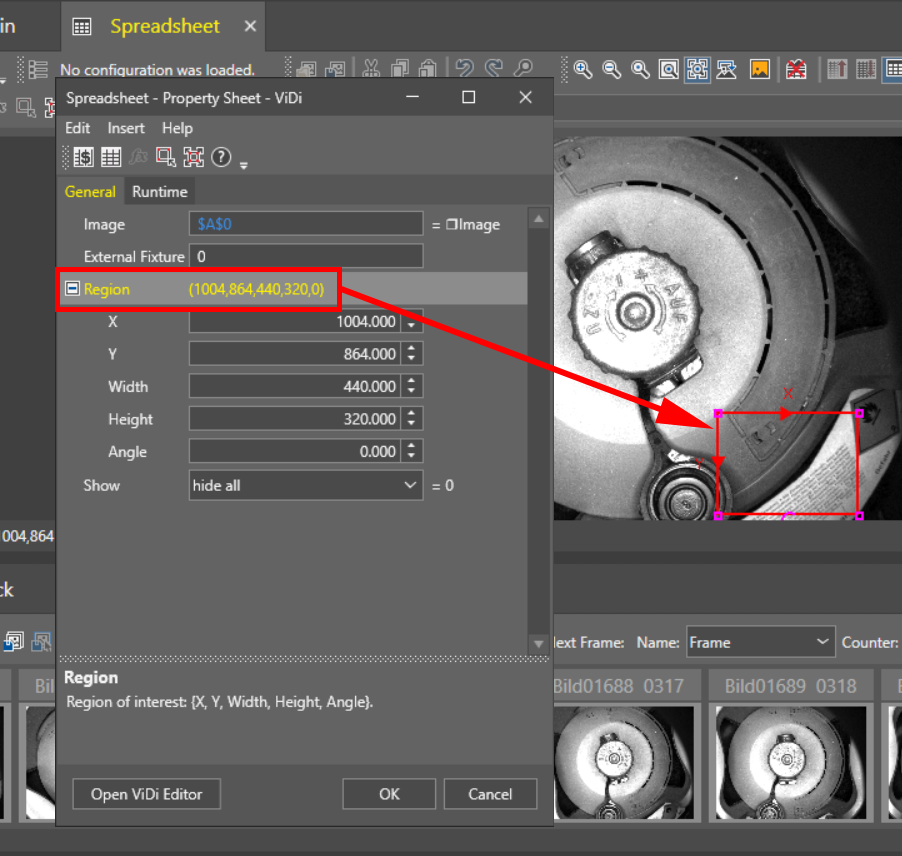
- Click Open ViDi Editor in the Property Sheet to configure the ViDi tool.
-
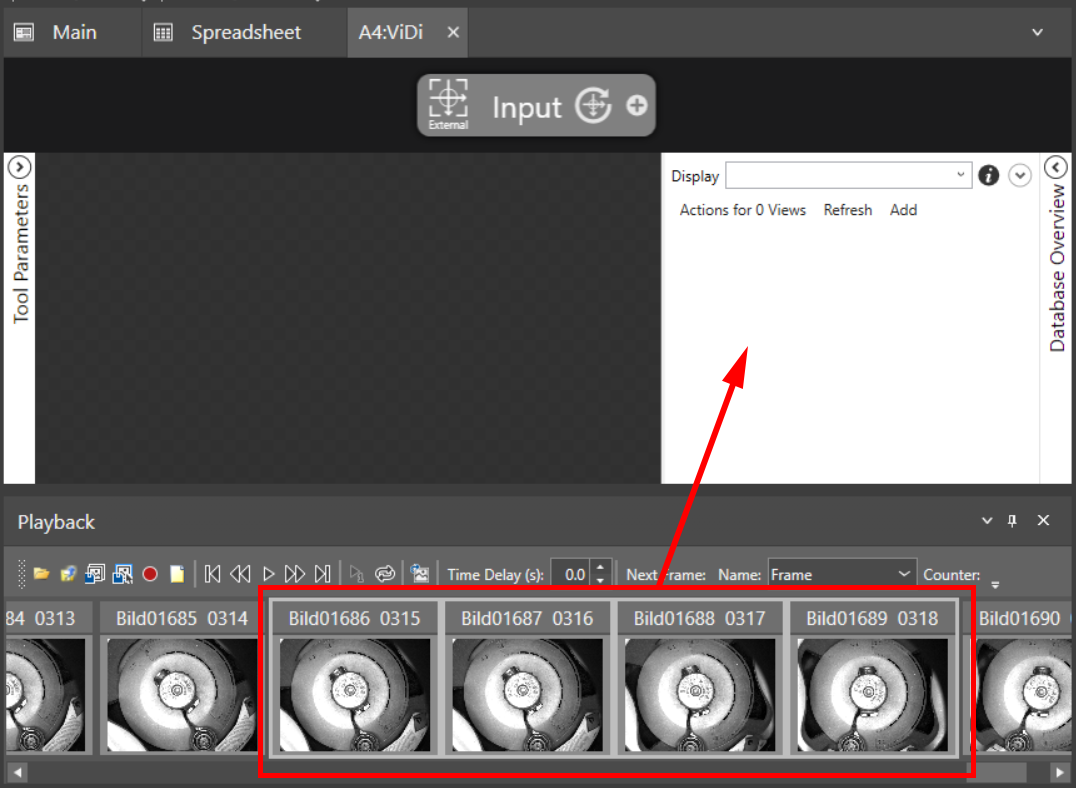
Add the images that you want to include in your training set by dragging and dropping from the filmstrip. The bigger the training set, the more reliable the results.
-
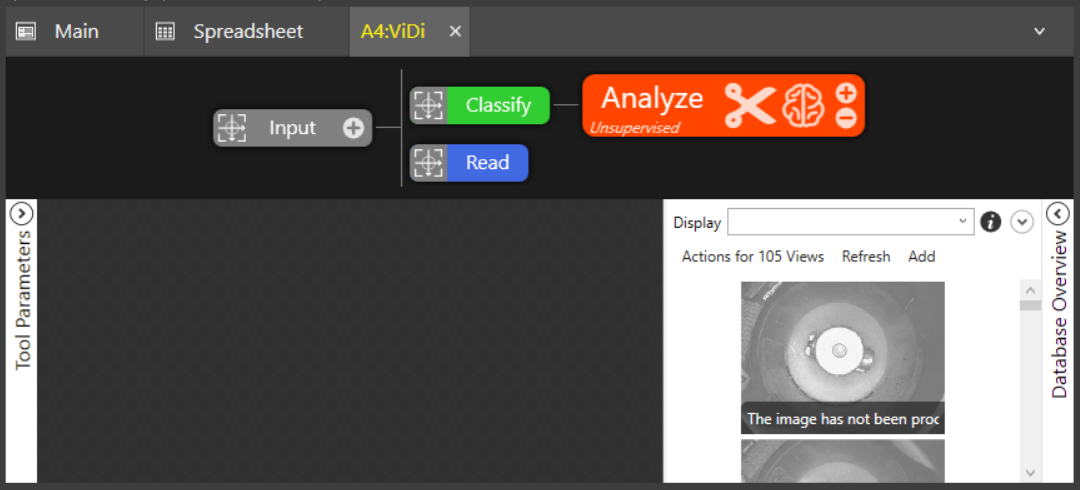
Click on the + icon next to Input at the top of the tab to open the tool options.
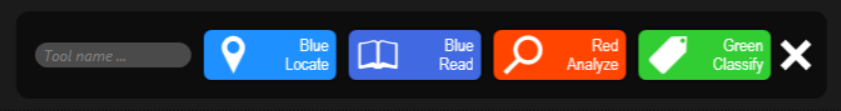
- Select the tool you want to use:
- Add the Blue Locate tool to the tool chain if you want ViDi to identify features on your images. For more information on configuring the Blue Locate tool, see Blue Locate Tool.
- Add the Blue Read tool to the tool chain if you want ViDi to identify text and numbers on your images. For more information on configuring the Blue Read tool, see Blue Read Tool.
- Add the Red Analyze tool to the tool chain if you want ViDi to identify defects and anomalies on your images. For more information on configuring the Red Analyze tool, see Red Analyze Tool.
- Add the Green Classify tool to the tool chain if you want ViDi to identify and classify parts on your images. For more information on configuring the Green Classify tool, see Green Classify Tool.
-
Add more tools to the tool chain as necessary. You can add tools to run in parallel or in sequence by clicking the + icon next to Input or the tool after which you want to add another tool. Click on a tool in the tool chain to select it. You can remove the selected tool from the tool chain by clicking the - icon next on the right of the tool box.
- Add labels to the images in your tools.
- Click the Brain icon at the top for each added tool to train your tools.
- Review your training images and verify that the results are correct.
ViDi Inputs
General Tab
| Parameter | Description | ||||||||||
|---|---|---|---|---|---|---|---|---|---|---|---|
|
Image |
This argument must reference a spreadsheet
cell that contains a valid Image data structure; by default, the cell references
A0, the cell containing the Image data structure returned by |
||||||||||
|
External Fixture |
Specifies a reference to a Fixture or Fixtures data structure. This fixture data is passed into the ViDi tools, and is used to define the views for each image. When using an external fixture, within the Region of Interest (ROI), select External. Then, from the Image Database menu, select Update All Training Fixtures, and modify the ROI of the ViDi tool. You can also update the ViDi tool reference to the external fixture data by right-clicking the ViDi data structure and selecting Update Training Fixtures. |
||||||||||
|
Region |
Also known as the Region of Interest (ROI), specifies the region of the image that undergoes analysis. Double-click on the Region parameter to create an Interactive Graphics Mode that you can transform and rotate. Select this parameter and press the Maximize Region button on the Job Edit toolbar of the property sheet to automatically stretch the region to cover the entire image.
|
||||||||||
|
Show |
Specifies the display mode for ViDi tools graphical overlays on top of the image.
|
Runtime Tab
Allows access to ViDi Processing Tool Parameters that can be modified while the job is online. These parameters do not require that the tool be retrained. You can drag and drop these parameter to the spreadsheet, and publish them to the HMI for operator interaction.
ViDi Outputs
|
Returns |
A ViDi data structure containing the neural network model of the ViDi tool or tools. |
|
Results |
When a ViDi function is inserted into the spreadsheet, a results table can be created, based on the ViDi Results Vision Data Access Functions by right-clicking on the ViDi data structure and selecting Insert Getters. |