Review Markings
Once the tool is trained, it can process images in the database, as well as newly acquired images, and place Markings on the features it finds. Markings are the VisionPro Deep Learning-generated outputs which are used to graphically display the neural network model's interpretation, along with generating the statistical results. They are the graphical elements that the tools place over characters, features and/or areas of the image that the tool identified, based on the Labeling done prior to being trained. For the Red Analyze Tool, the Marking consists of an anomaly score, and a heat map (aka deviation map) and polygon regions that outline defects and/or anomalies.
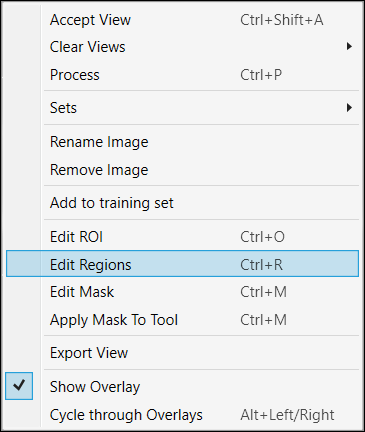
You can toggle the display of labels and markings by either using the Alt + Left arrow and Alt + Right arrow keys, or from the right-click menu in the image.
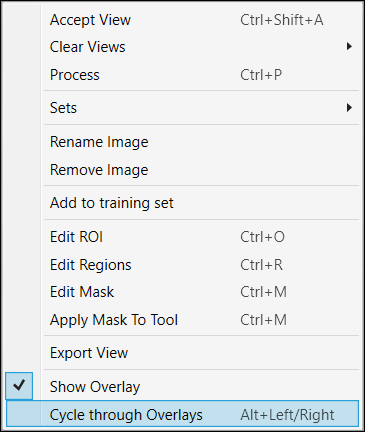
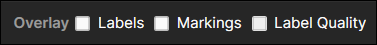
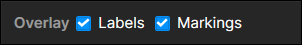
You can also show overlay with enabling the "Markings" at the Overlay Checkbox.
Markings and Results
Image results are displayed via the following mechanism:
| Image with defects | Middle score image | Defect-free image |
|---|---|---|
|
|
|
|
|
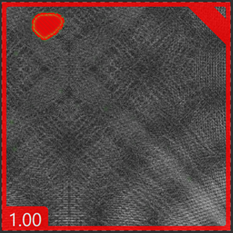
Images with a high score and a red border indicate that there is a defect(s). The defect will be indicated with a red area outline. |
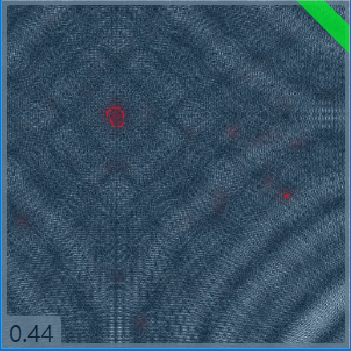
Images that return a middle score will have a grey border, and may require further adjustment of the tool's parameters. |
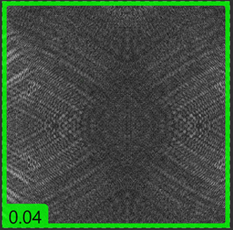
Images with a low score and green border indicate that there are no defects detected. |
One method for compensating for middle score images is to adjust the tool's Score (Score and ROC Curve) thresholds to allow for either higher or lower scores to properly classify the images. However, this method only works if there is a gap between the good and bad images classification. If there is no gap, the tool would be classifying more images as false results.
Overlay Checkbox
The 2 tables above are shown back and forth or side by side, with the overlay graphics of labels and markings, whenever you press Alt + Left/Right (Keyboard Shortcuts When Working with an Image) or enable each checkbox (Labels and Markings) on Overlay Checkbox.
Region List
The region list is the table displayed on the bottom of Image Display Area that shows the information of each defect region. It consists of 2 tables, each holds the information for the labeled defect region (the defect region you labeled for training) and the marked defect region (the predicted defect region as the result of processing). Each row in a table represents the information of each defect region.
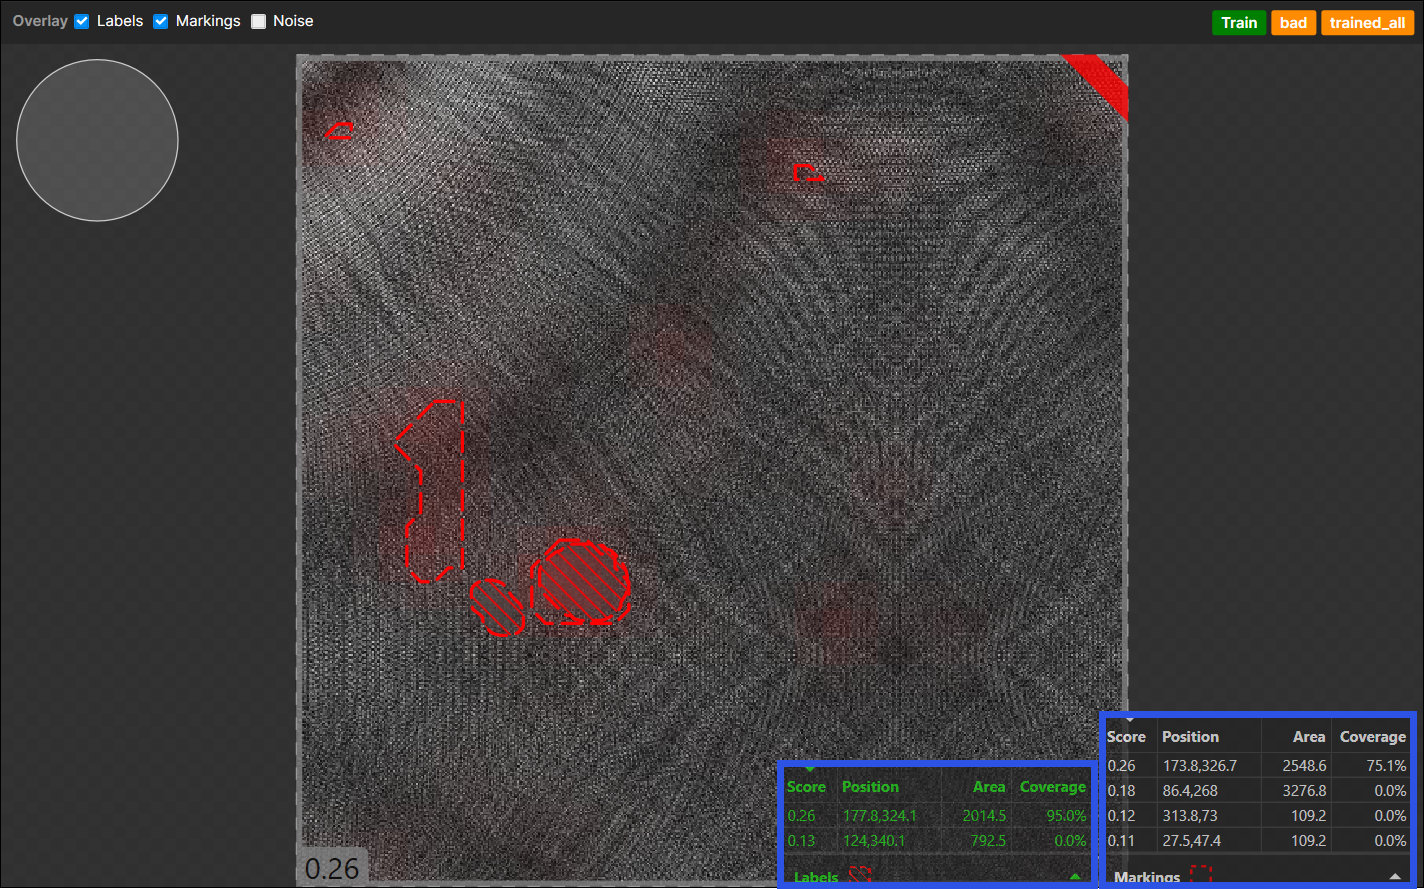
For each table, you can click a row to highlight its information both in the table and Image Display Area.
| Column | Description |
|---|---|
|
Score |
The highest defect probability among the defect probabilities of each pixel in the defect region, as the result of processing. For the Labels table, this represents the highest defect probability for a region that was labeled as a defect region. For the Markings table, this represents the highest defect probability for a region that was predicted as a defect region. |
|
Position |
The x, y coordinate of the center of the defect region. |
| Area | The number of pixels in the defect region. |
|
Coverage |
The overlapping ratio between the labeled defect region and the predicted (marked) defect region. |
Review Markings and Fine-tune Training
Adding more labels and readjusting the training image set is another method to compensate for middle score images.
In this scenario:
-
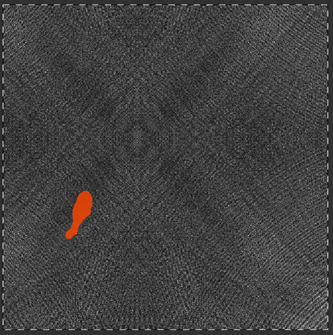
Identify an image with a middle score that does not appear to be properly marked.
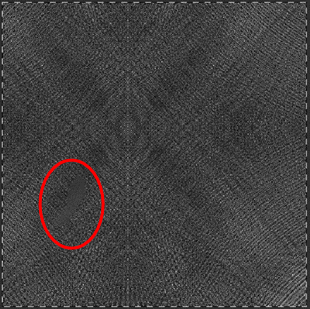
- Make sure that the image is improperly marked. In this example, in the above image, the overlay markings have been hidden (by pressing Alt+Arrow key), indicating that the defect area was improperly drawn.
- Accept the view in order to retain the area already marked as a bad region.
-
Edit the Region.
-
Properly fill in the defective region.
-
Optionally, if the tool is having difficulty with this particular image, you can add the image to the list of images that are always used when training.
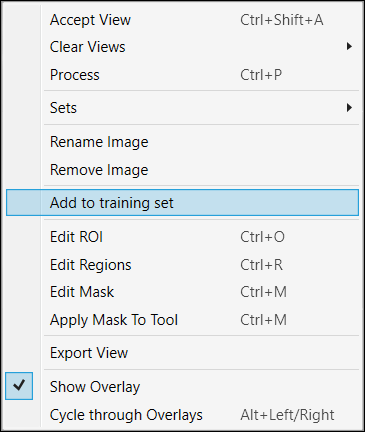
To provide more labeled data for further training, you can convert some of the Markings to Labels. In this instance, you review the Markings that the tool applied, and if you agree with the Marking, you accept the View and convert the Marking to a Label.
For example, the Blue Locate Tool requires that N number of features are labeled on the View. After the tool is trained, the result is reported in the form of a Marking, which is a graphical overlay on the View. You review each of the Markings, and if it is accurate, you right-click the View and select Accept View to convert the Marking to a Label. For more details, see How to Label Fast: Bootstrap Labeling.