Create Label (Labeling)
Labels are the user-generated input data that establish the ground truth for the tool. Ground truth refers to the undisputed facts about the images in your application, in other words, what you, as the human determine to be the key information within the image (feature, character, defect, class). Labels establish the ground truth, which is used for both training and performance analysis. So it is imperative that you label accurately.
What is Labeling
Since the Deep Learning software is based on learning, what the network is taught about the images is vitally important. Within the Deep Learning parlance, this process is termed “labeling.” Labeling is the process of a user identifying features or defects, and graphically illustrating them on the image. The label represents the ground truth for the tools and is used to train the tools and validate their performance.
The label is the ground truth for the tool, in other words, you are telling the tool, "this is what it should learn." The most important part of programming the tools is ensuring that the images that are being used for training are completely and accurately labeled. Without knowing the ground truth data for the images, you cannot tell whether the tool is working properly or not. Also, without accurate labeling, the tool's training will not work as well.
When you are evaluating the performance of your tools and application, performance is always measured against the labeling that you provide. If your labeling does not reflect the actual ground truth for your images, then accurate and repeatable tool performance will not mean anything. When you train the Deep Learning tools, the goal for training – the cost function – is attempting to train the tool to produce a response that precisely matches the labeling that you provide.
For each of the tools, labeling is a manual operation (see below for the specifics of how labeling is performed for each tool). The most important characteristic of good labeling is that it is consistent, both between images and between observers and people performing the labeling. If you provide an image set to multiple people to label, and their labels do not agree, then the tool will likely not work well.
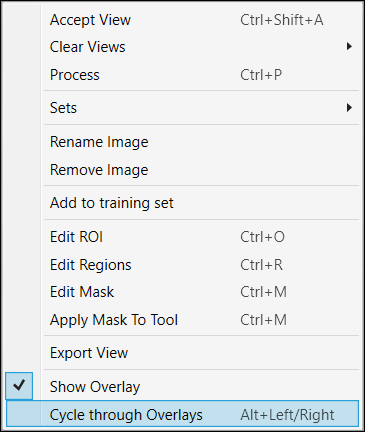
For each tool, there is a slightly different process, but the principle is the same. Once Labeling is completed, you will be ready to train the tool, and examine the Markings that the tool provides. You can toggle the display of labels and markings by either using the Alt + Left arrow and Alt + Right arrow keys, or from the right-click menu in the image.
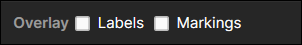
You can also show overlay with enabling the "Label" at the Overlay Checkbox.
Labeling in Red Analyze Focused Supervised
In Red Focused Supervised and Red Analyze High Detail, the labeling process involves first labeling "good" and "bad" images, in other words, images that are defect-free and contain defects. Then for the bad images, you draw regions over the pixels that contain the defects. The accuracy with which your labeled defect masks match the actual defects in the images is a key determinant in the performance of the tool.
|
|
|
|
1 |
Defect |
|
2 |
Labeled defect (region drawn over the defect) |
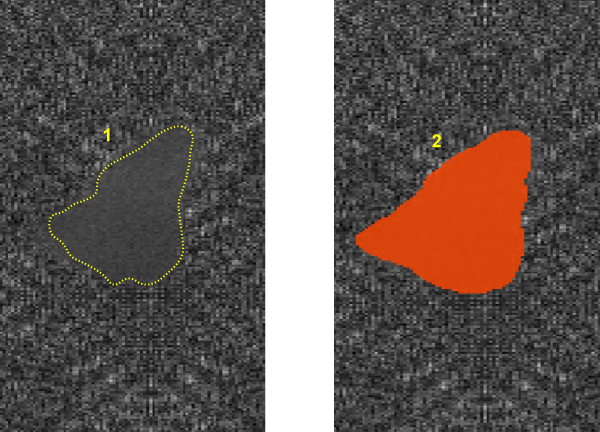
For Red Analyze Focused Supervised, you have to first identify the defects in the Views, and then carefully label the defects by graphically drawing defect regions over them.
-
To label defects, right-click within the View and select Edit Region from the menu.
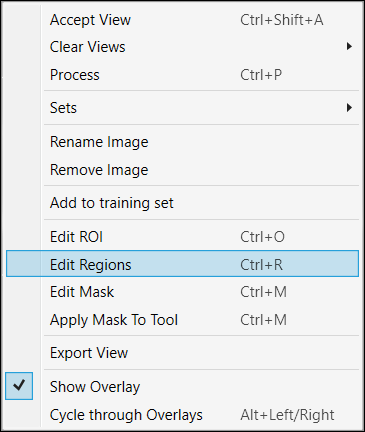
-
This will launch the Edit Regions toolbar at the top of the image.
 Note: The Edit Regions toolbar is the same as the Edit Masks toolbar. For more information about the functionality of the buttons in the toolbar, see the Edit Mask (Optional) topic.
 -
There are three drawing tools, and they can be used in conjunction. The size of the area drawn is defined by the Width value.
-
Line: Click and drag to create a line in your image.
Tip:- Hold down the Shift key while drawing, and the tool will draw a straight line between two points.
- If you want to fill in a rectangular area, draw the outline using the line drawing tool (hold down the Shift key to create straight lines), and then fill it in using the magic wand tool.
-
Circle: Place the cursor at the center of your circular object, and drag outward.
Tip: Hold down the Shift key to have the circle expand from the corner of a bounding box. - Magic Wand: Click and drag to fill in areas of the image. You can also click on individual features to apply fill to just that area.
Note: The Eraser tool can be used to trim and/or remove extraneous drawings on the image.When drawing Regions around the defects, try and draw the Region as precisely and consistently as possible. While drawing small amounts of the Region outside of the defect is acceptable, larger areas should be avoided. This can result in the tool thinking that the background has been labeled as defect. Likewise, under filling a defect should also be avoided.
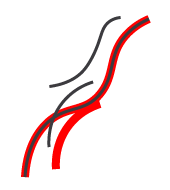
The graphics below illustrate the best methods for drawing Regions around a defect, where the dark grey lines represent the defect, and the red is the Region defining the defect.
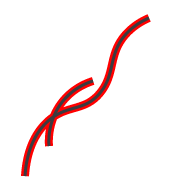

This is the ideal way to draw the Region, with it closely aligned to the defect.
This method encompasses too much of the background, and will result in the tool considering the background as a defect, as well.
This method missed parts of the defect, so the tool will consider the parts not outlined in red as not being a defect.
-
- Once you have carefully and accurately drawn your defect Region, press the Apply button. You must do this on an image-by-image basis.
- Once you have drawn all the necessary Regions, press the Close button prior to training the tool.
- Create a Red Analyze tool and leave it in its default Unsupervised mode and set the tool’s ROI.
- Open the Database Overview.
- Launch the Edit Regions functionality, draw some defects and apply the changes.
- With the Edit Regions editor still open, switch the tool from its default mode (Unsupervised) to Supervised.
- Select another view, draw some defects and apply the changes.
- Note that the thumbnails in the View list and in the Database Overview will be out of sync with the name in the Edit Regions editor.
To resolve the naming discrepancies, close the Edit Region editor and toggle the mode, which will cause the tool to merge and then correctly rename the regions.
How to Label Smart: AI Labeling Tool
Within the AI labeling tool, you have access to two essential tools: the AI Click Tool and the AI Box Tool. These tools have been designed to streamline the labeling process, eliminating the need for manual drawing of each individual label. Instead, they provide intuitive methods for recognizing and labeling regions automatically.
-
AI Click Tool:
The AI Click Tool simplifies region labeling with the power of clicks. With a simple left-click of your mouse, the tool automatically identifies and generates regions for the selected objects, streamlining the labeling process. If any regions need to be removed or adjusted, a simple right-click does the job. -
AI Box Tool:
The second tool at your disposal is the AI Box Tool. This tool offers an efficient means of region labeling. With it, you can define regions by drawing rectangular boxes around the objects of interest. This visual and user-friendly approach allows you to easily create regions for labeling purposes. To use this tool, just draw a box around the object you wish to label, and a region will be generated based on the shape of the box.
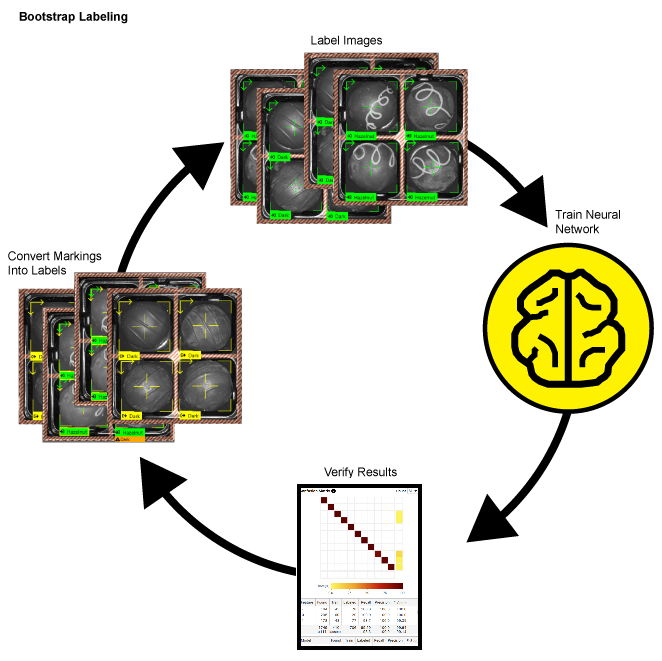
How to Label Fast: Bootstrap Labeling
You can consider using the bootstrap method of labeling your images to speed up the labeling process for each tool. "Bootstrap" labeling refers to the process of beginning your labeling process by just labeling a small sample size of your images, then training the tool, and reviewing the results by accepting views with correct markings to convert them into labels, and removing incorrect markings and replacing them with correct labels. You can speed up this process further by dividing images into multiple views and only labeling a single view. In addition, you can also temporarily reduce the Epoch Count in Training parameters, which will make the training time shorter.
- Label a few images in your Training Set.
- Train the tool.
- Review the images and results.
- Accept the views where the tool's markings are accurate (right-click and select Accept View, or Ctrl + Shift + A). This will change the marking into a label. For the Red Analyze tool in Supervised mode, you may have to edit the defect region. For markings that are inaccurate, clear the markings from the image (right-click and select Clear Marking, or Ctrl + C), and then add the correct label.