Process Neural Network (Inferencing)
At runtime, each sample from the runtime image is processed individually, using the tool's trained network, and an individual network response is obtained for each sample. The response from the network is expressed as a probability map, where each pixel in the sampled region of the input image is assigned a probability. The meaning of the probability map depends on which tool is being used. For the Red Analyze Focused Supervised, the response is the probability for each pixel in the sampling region, that the pixel is within an image defect. These whole-image probability maps are assembled from the interpolated network responses to individual samples. The final results returned to the user (feature poses and identities, and defect regions) are based on a results formation process that the user controls by specifying thresholds for defect probability.
In the above context, it is important to understand that the probability returned by a tool may not reflect well with our notion of how likely a certain judgment is. This is mostly due to the fact that the tools have a "limited view of the world" in that they do not return probabilities with respect to our wide and rich visual experience, but rather with respect to their very limited visual world of a couple of classes.
The processing (inferencing) of a trained tool is automatically executed when the training is finished without issues. If you want to manually re-process the trained tool, click ![]() button.
button.
Feature Sampling for Processing
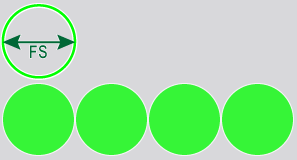
Each input image is exhaustively sampled at runtime, and the individual samples are then processed by the trained network. The same feature size used for training is also used at runtime (ensuring that the trained network is processing inputs that are consistent with the inputs used for training).
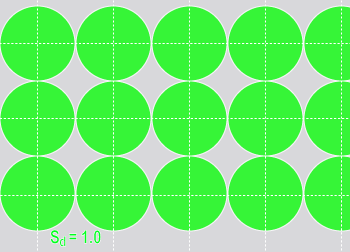
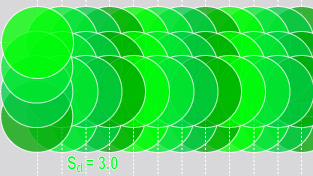
Unlike training, where the sampling density is determined automatically, you can control the runtime sampling density for all the Deep Learning tools. The sampling density determines the degree of overlap between adjacent samples. A sampling density rate of 1 means that the sampling location is incremented by the feature size between samples. The default sampling density rate for most tools is 3, which means that the sampling location is incremented by one third of the feature size.
| Sampling Density = 1 (4 samples) | Sampling Density = 3 (4 samples) |
|---|---|
|
|
|
Configure Processing Parameters
The Processing parameters control the way that images are processed by the tool. This is often called ‘inference’ in deep learning. Processing with the same models will always give you the same results. Changing these parameters does not require the tool to be retrained; the effect can be seen right away by reprocessing the database. To re-process the tool, click ![]() button.
button.
| Parameter | Description | ||||
|---|---|---|---|---|---|
|
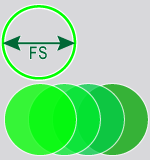
Sampling Density |
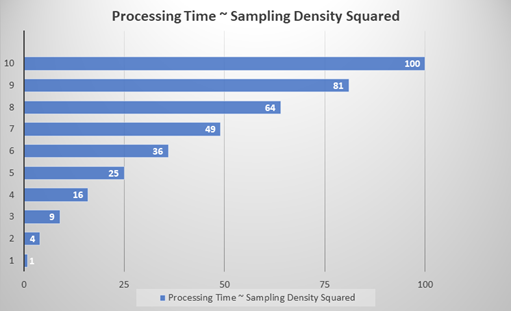
Specifies the density of sampling points with respect to the tool's Feature Size (FS) setting. The sampling density determines the degree of overlap between adjacent samples. A sampling rate of 1 means that the sampling location is incremented by the feature size between samples. The default sampling rate for most tools is 3, which means that the sampling location is incremented by one third of the feature size. Tip: One key aspect of the Sampling Density parameter is the relationship between the tool's processing time and accuracy. A tool's processing time depends approximately quadratically to the Sampling Density (Sd) value. For example, a Sampling Density setting of 1 is approximately nine times faster than a setting of 3 (n2). While higher Sampling Density settings are more accurate, it significantly impacts the processing time of the tool.
|
||||
|
Threshold |
There are two settings, T1 and T2 (expressed as [T1,T2]. They determine the threshold which determines whether or not regions are detected and marked as good or bad. Values below T1 will be classified as good, and values above T2 will be classified as bad. The T1 and T2 values can also be set interactively using the Scores graphic in the Database Overview. |
||||
| Auto | When you enable Auto (Auto-Threshold), it calculates Threshold values T1 and T2 that maximize the F1 score of confusion matrix on Database Overview by following each criterion in the dropdown menu. The 4 criteria are the same as the ones in Count dropdown menu on Database Overview. See Score Count Filter for more information. | ||||
|
Simple Regions |
Specifies that the tool should only extract only "simple regions", in other words, polygons without holes. |
||||
|
Specifies a filter for the tool to be used as criteria for found regions. By specifying a filter, regions that do not match the filter will be removed from the results. If the parameter is left blank, all regions will be returned. Note: The syntax for filters is the same as that used for Display Filters. For more information about constructing the syntax for a filter, see the Custom Display Filters.
The available region properties are:
|
|||||