EditCompositeRegion
Inserts an interactive composite region control into the spreadsheet. When the control is clicked, the display switches to EditCompositeRegion - Interactive Graphics Mode, where the composite region can be modified. A composite region can consist of multiple subregions. A subregion can be an Annulus, Circle, EditPolygon or Region. Each subregion is an add operation (included in the image analysis) or subtract operation (excluded from the image analysis). The subtract operation is also known as "masking".
Opening the EditCompositeRegion Property Sheet
- Right-click on a cell and select Insert Function to open the Insert Function Dialog.
- In the left side of the Insert Function dialog, expand the Graphics list of tool categories.
- Select the Controls tool category.
-
Select the EditCompositeRegion function from the function list and press the OK button or double-click the function name.
Note: To access the Property Sheet for EditCompositeRegion, right-click the EditCompositeRegion control button and select Edit Function
EditCompositeRegion Inputs
General Tab
In the EditCompositeRegion property sheet, the General tab is used to define the parameters of the EditCompositeRegion function.
| Parameter | Description | ||||||
| Image | This parameter must reference
a spreadsheet cell that contains an Image data structure; by default, this parameter references A0, the cell containing the Image data structure returned by |
||||||
|
Fixture |
Specifies the image coordinate system in which the input composite region is defined.
|
||||||
|
Add Subregions |
If checked (default), subregions can be added in Interactive Graphics Mode. |
||||||
|
Remove Subregions |
If checked (default), subregions can be removed in Interactive Graphics Mode. |
||||||
|
Edit Subregions |
If checked (default), subregions can be modified in Interactive Graphics Mode. |
||||||
|
Move Entire Composite |
If checked (default), the entire composite region can be moved in Interactive Graphics Mode. |
||||||
| Rotate | If checked (default), the entire composite region can be rotated in Interactive Graphics Mode. | ||||||
|
Name |
Specifies a text label for the EditCompositeRegion control element in the spreadsheet. |
||||||
|
Show |
Specifies the display mode for the EditCompositeRegion graphics overlay on the image.
|
Regions Tab
In the EditCompositeRegion property sheet, the Regions tab allows you to add, insert, remove, MoveUp, MoveDown and edit an ordered list of subregions which make up the total composite region. A subregion's type can be an Annulus, Circle, EditPolygon or Region that is used to perform an add or subtract operation.
Region Tab Controls
- Add: Adds a new subregion to the end of the list.
- Insert: Inserts a new subregion above the currently highlighted subregion.
- Remove: Removes the highlighted subregion from the list.
- Move Up: Moves the highlighted subregion up in the list.
- Move Down: Moves the highlighted subregion down in the list.
- Subregion Properties: Displays the properties for the highlighted subregion.
EditCompositeRegion Sequence
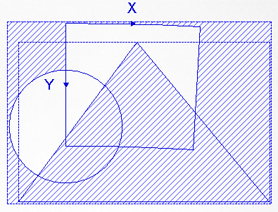
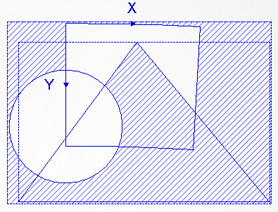
The composite region is built in sequence, based on the order of the subregions within the list. The order each subregion's operation occurs affects the overall area of the composite region.
For Example:
Changing the order of the polygon subregion changes the composite region. The area of the image with blue hash lines is excluded from the image analysis.
|
|
||||||||||||||||||||||||
|
|
EditCompositeRegion Output
|
Results |
A labeled Button |
 control.