ViDiCheck
The ViDiCheck function allows you to create a deep learning-based verification solution, based around the Layout Model of the Blue Locate tool. The ViDiCheck tool allows you define the image features to be found in your images and associate them with a region using a Layout Model.
The ViDiCheck tool returns a pass or fail status for each region in the Layout Model, along with the names of the features associated with the regions in the model.
To use the ViDiCheck function:
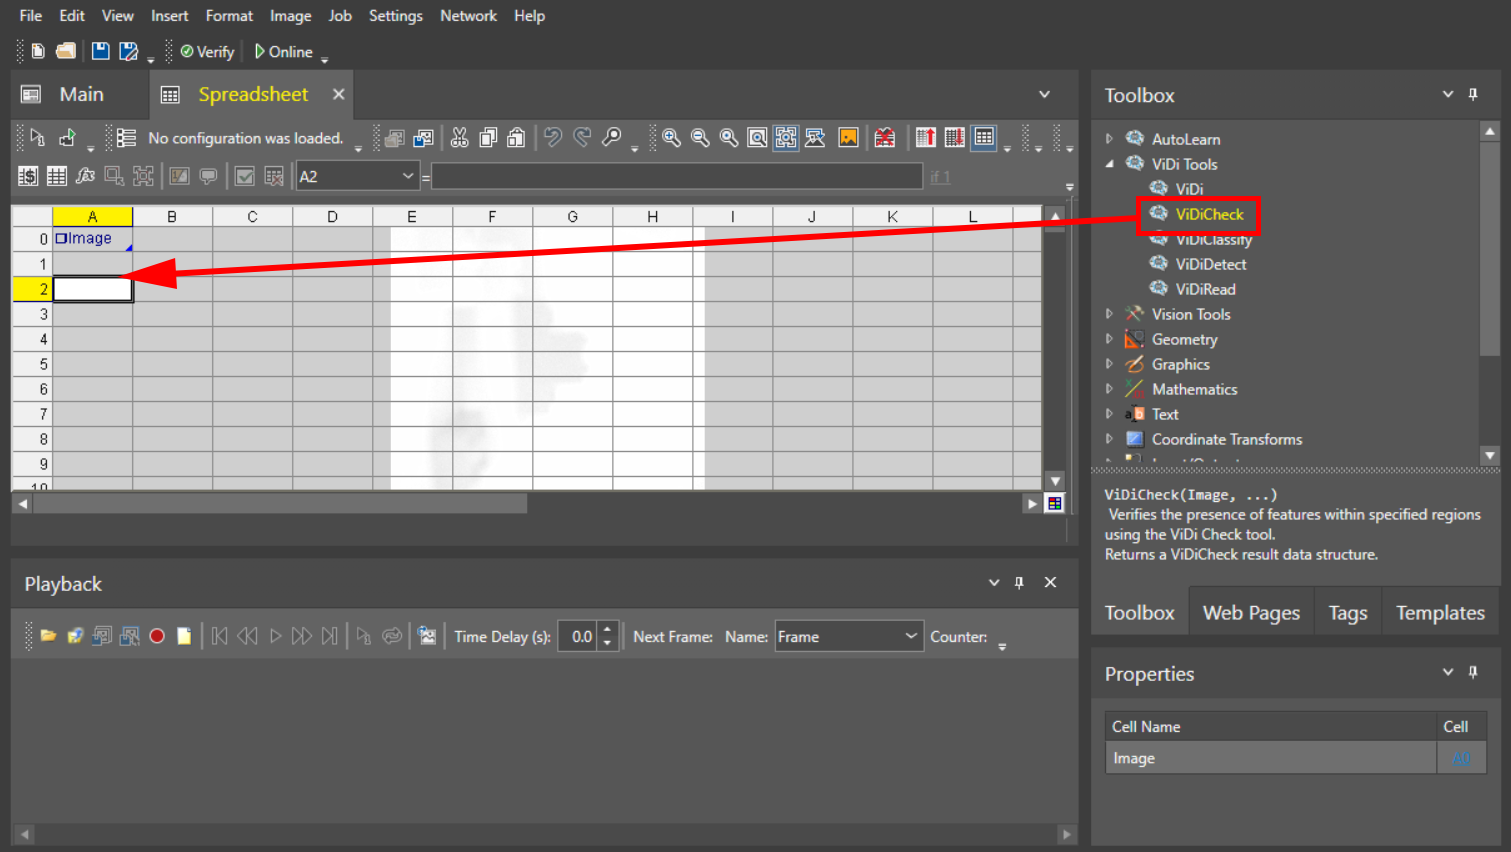
- Select the ViDiCheck tool from the ViDi Tools dropdown in the Toolbox.
-
Drag and drop the VidiCheck tool to the desired cell of the Spreadsheet.
-
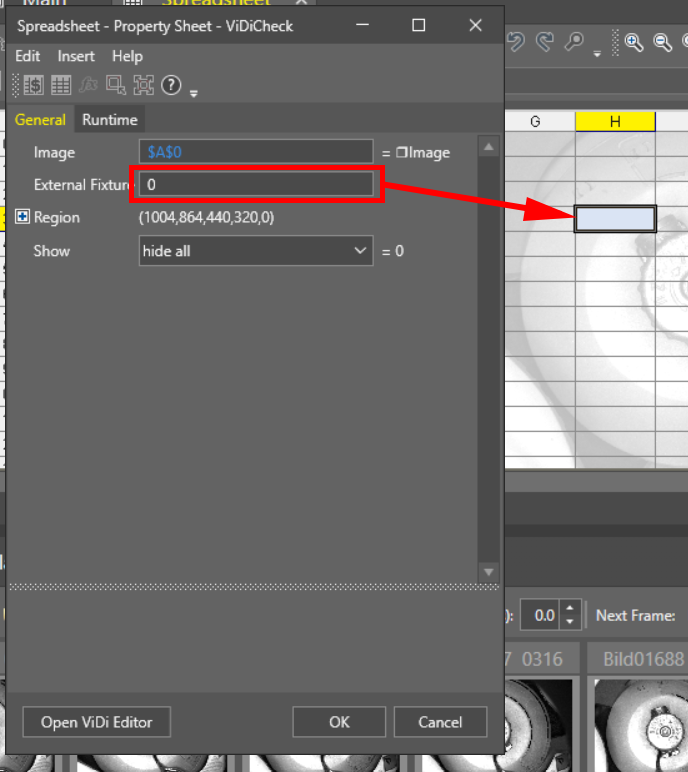
Set External Fixture in the Property Sheet that automatically opens:
- Set to 0 if you do not want to use an external fixture.
- Specify a fixture defined in another cell by clicking in the External Fixture text box, and then clicking on the cell in Spreadsheet, or by manually entering the cell reference.
-
Set Region in the Property Sheet:
- Define the X and Y offset from the Fixture origin and the region width and height in pixels, and the rotation of the region compared to the Fixture X axis in degrees.
- Alternatively, double-click on Region and visually edit the region of interest.
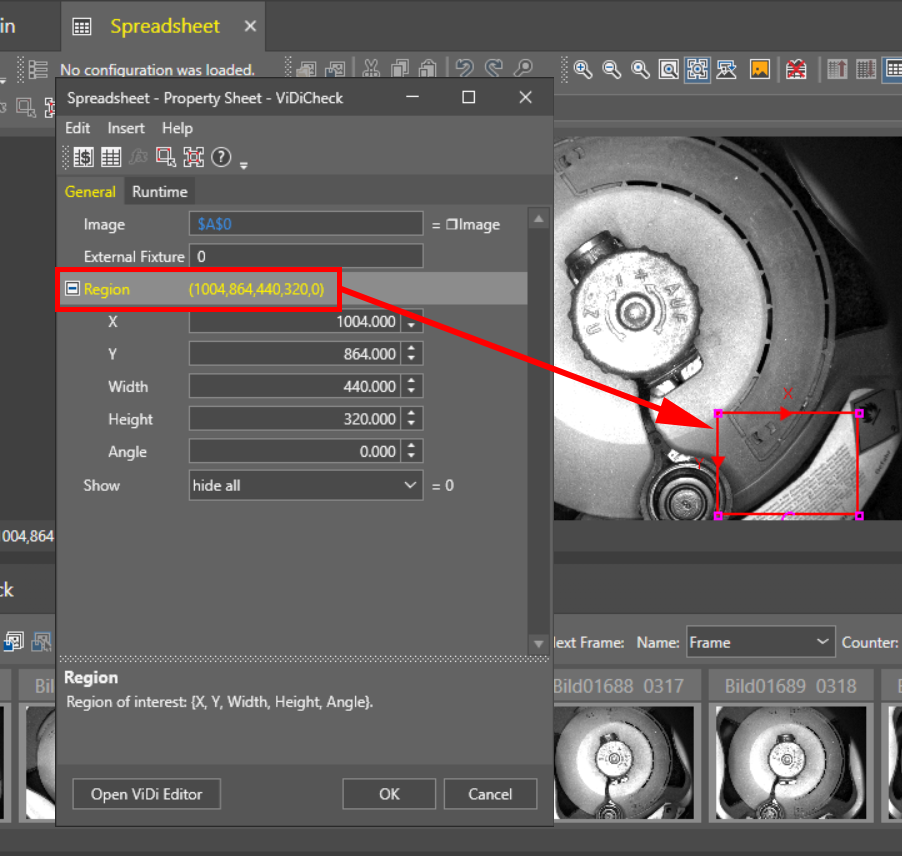
- Click Open ViDi Editor in the Property Sheet to configure the ViDiCheck tool.
-
Add the images that you want to include in your training set by dragging and dropping from the filmstrip. The bigger the training set, the more reliable the results.
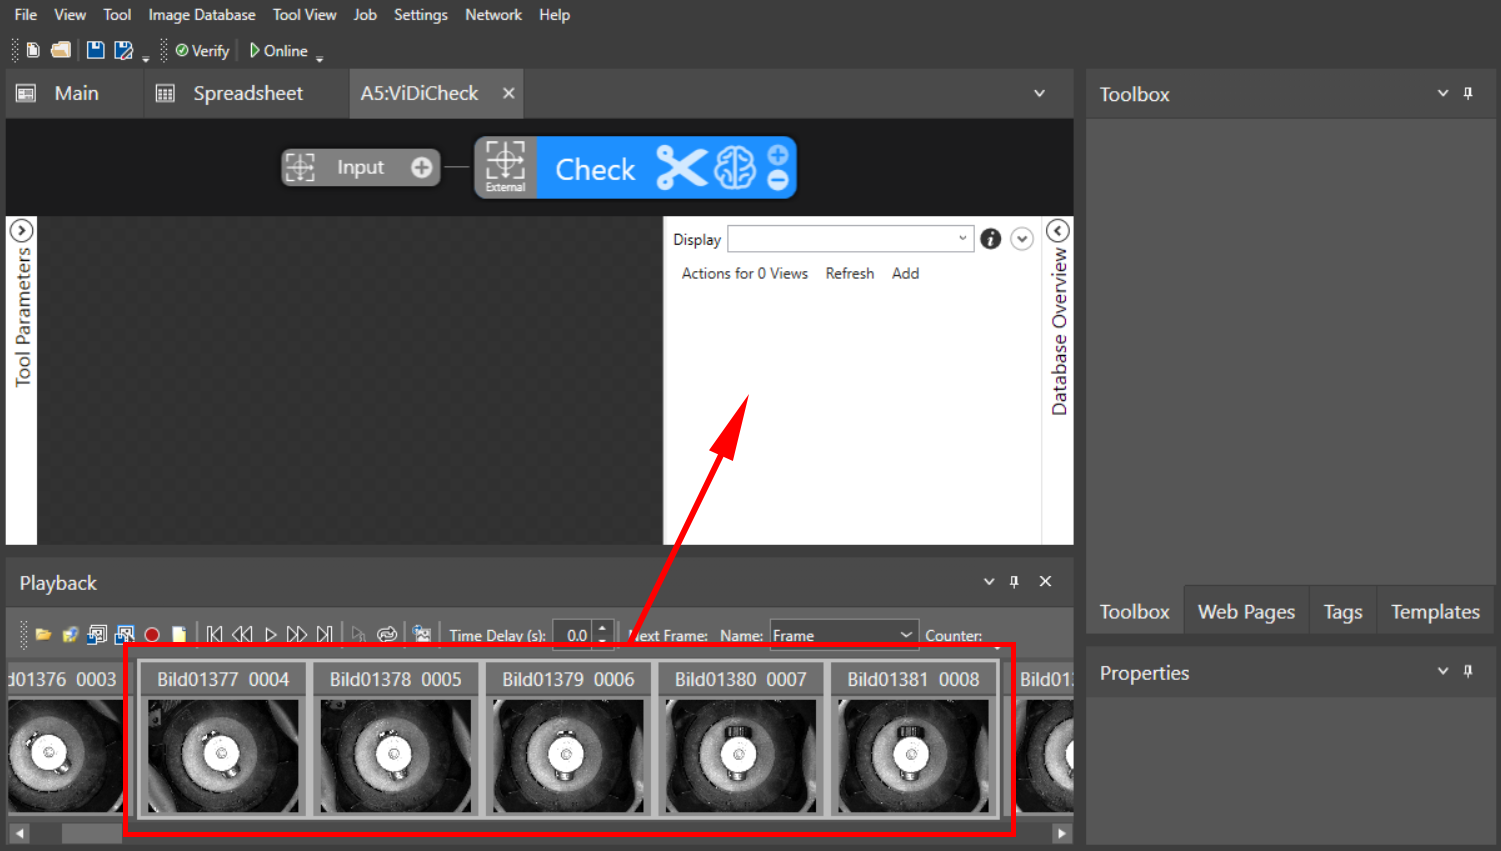
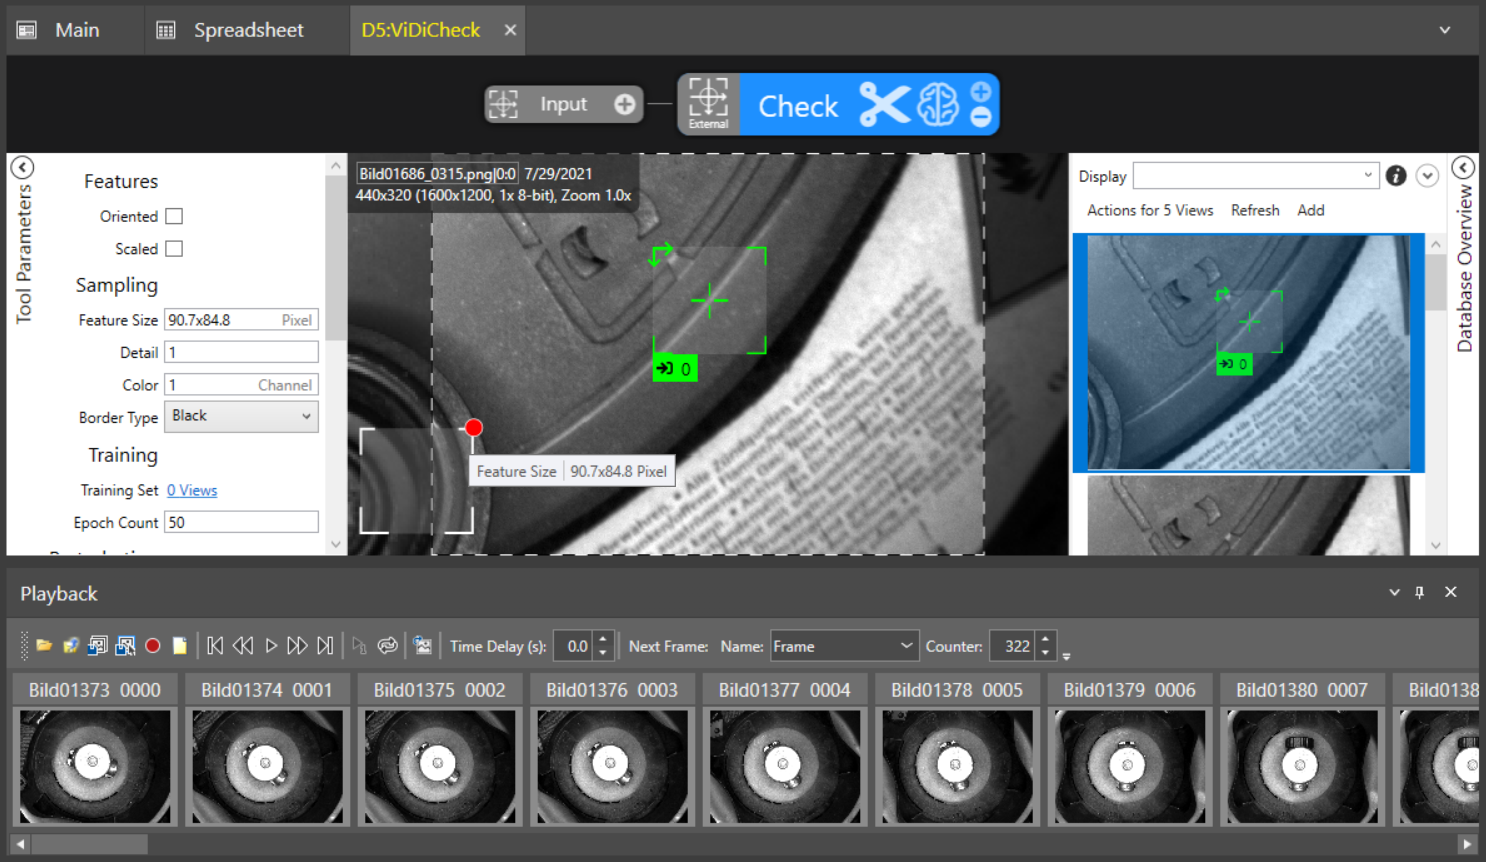
- Label the features that you expect to make up your model:
Click on an area of interest to create a feature box for the label.
Center the feature box on the feature you want to label, and adjust the Feature Size parameter using the interactive white adjustment box in the bottom left corner of the image display.
 Note:
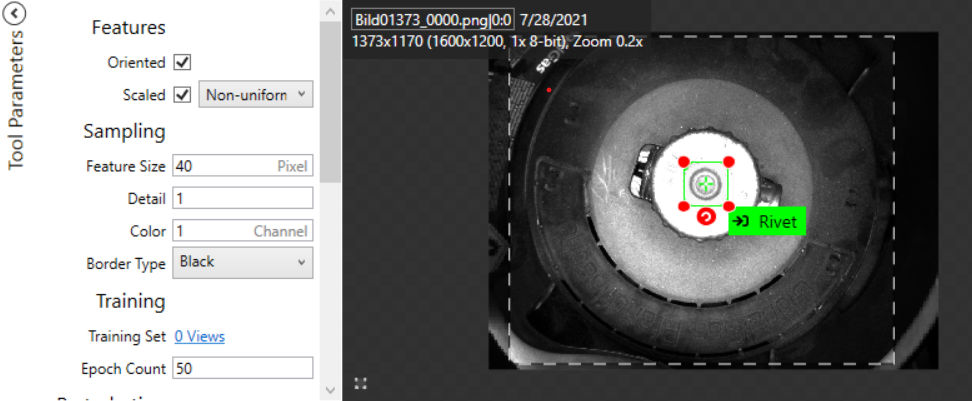
Note:If necessary for your application, you can enable direct feature box resizing and rotation by expanding the Tool Parameters sidebar and checking the Oriented and Scaled checkboxes. Select Non-uniform in the Scaled dropdown to enable freeform sizing.
However, this will result in longer processing times, as it requires non-uniform scale and rotation measurements, and can also cause a higher rate of false matches. You can get better results labeling parts with different rotations, or adjusting the Rotation Perturbation parameter in the Tool Parameters sidebar.
- Place the box on the image feature that you want to train ViDi to look for.
- Name the label by clicking in the green textbox in the corner of the label.
- Repeat for each image feature and every image in the training set.
- Click the blue Brain icon at the top to train the tool.
- Add a Layout Model and configure one or more regions, along with the features expected to be within the region, and the sum of the features within the region. For more information about configuring the Layout Model, see the Creating a Layout Model topic.
- Review your training images and verify that the results are correct.
ViDiCheck Inputs
General Tab
| Parameter | Description | ||||||||||
|---|---|---|---|---|---|---|---|---|---|---|---|
|
Image |
This argument must reference a spreadsheet
cell that contains a valid Image data structure; by default, the cell references
A0, the cell containing the Image data structure returned by |
||||||||||
|
External Fixture |
Specifies a reference to a Fixture or Fixtures data structure. This fixture data is passed into the ViDi tools, and is used to define the views for each image. When using an external fixture, within the Region of Interest (ROI), select External. Then, from the Image Database menu, select Update All Training Fixtures, and modify the ROI of the ViDi tool. You can also update the ViDi tool reference to the external fixture data by right-clicking the ViDi data structure and selecting Update Training Fixtures. |
||||||||||
|
Region |
Also known as the Region of Interest (ROI), specifies the region of the image that undergoes analysis. Double-click on the Region parameter to create an Interactive Graphics Mode that you can transform and rotate. Select this parameter and press the Maximize Region button on the Job Edit toolbar of the property sheet to automatically stretch the region to cover the entire image.
|
||||||||||
|
Show |
Specifies the display mode for the graphical overlays of the ViDiCheck tool on top of the image.
|
Runtime Tab
Allows access to ViDi Processing Tool Parameters that can be modified while the job is online. These parameters do not require that the tool be retrained. You can drag and drop these parameter to the spreadsheet, and publish them to the HMI for operator interaction.
ViDiCheck Outputs
|
Returns |
A ViDiCheck data structure, containing the results of the trained tool. The results are based on the names of the Layout Model regions contained within the tool, along with a pass/fail status for each region and the names of the features associated with the region. |
||||||||||||||||||||||||||||||||||||||||||||||||||||||||||||||||||||||||||||||||||||||||
|
Results |
After the ViDiCheck tool has been trained, a result table can be generated, based on the ViDi Results Vision Data Access Functions, by right-clicking on the function's data structure and selecting Insert Getters. Note: When the Vision Data Access Functions are automatically generated, the default setting auto-populates the first five features to the table. If there are more than five features, you need to manually add them to the table. If you want to display more entries, you can expand the table by copying the last row and pasting additional rows at the end. Make sure to increment the index number of any newly-pasted row so that the proper feature is indexed.
|