ViDiDetect
The ViDiDetect tool allows you to create a deep learning-based defect detection solution, based on the Red Analyze tool in Unsupervised mode. With this tool, during the training phase you teach it only what a good part looks like, including any and all acceptable variations. Then, at runtime, it will discover any anomalies from the learned appearance, and return a deviation score and a pass/fail result.
To use the ViDiDetect function, perform the following:
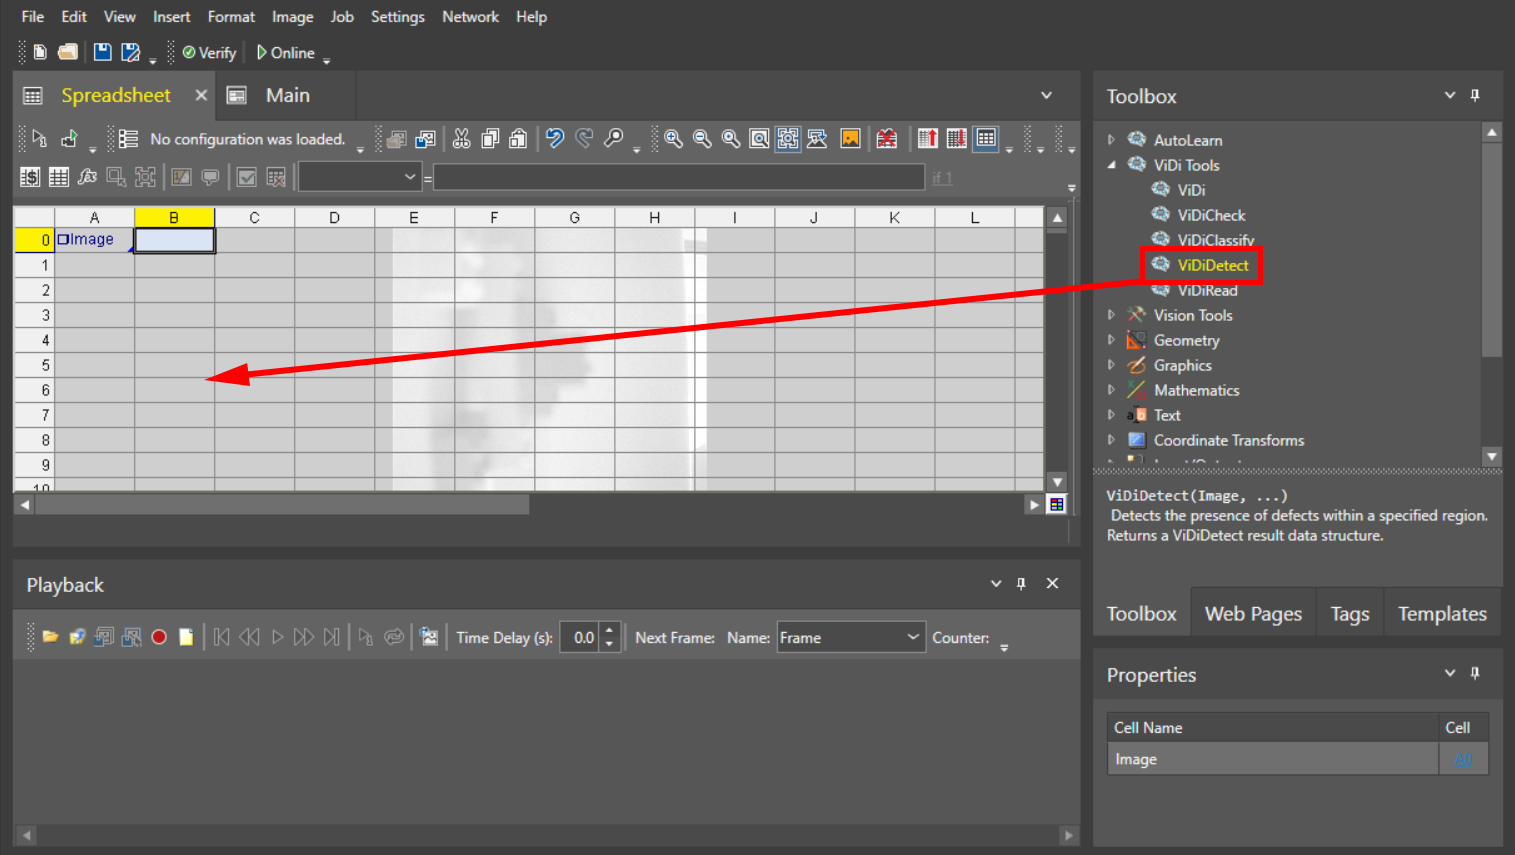
- Select the ViDiDetect tool from under ViDi Tools in the Toolbox.
-
Drag and drop the VidiDetect tool to the desired cell of the Spreadsheet.
-
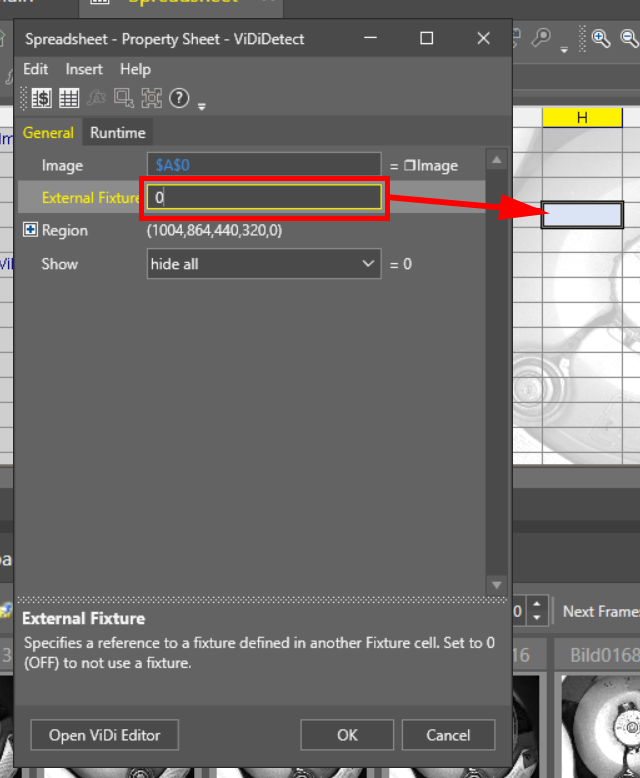
Set External Fixture in the Property Sheet that automatically opens:
- Set to 0 if you do not want to use an external fixture.
- Specify a fixture defined in another cell by clicking in the External Fixture text box, and then clicking on the cell in Spreadsheet, or by manually entering the cell reference.
-
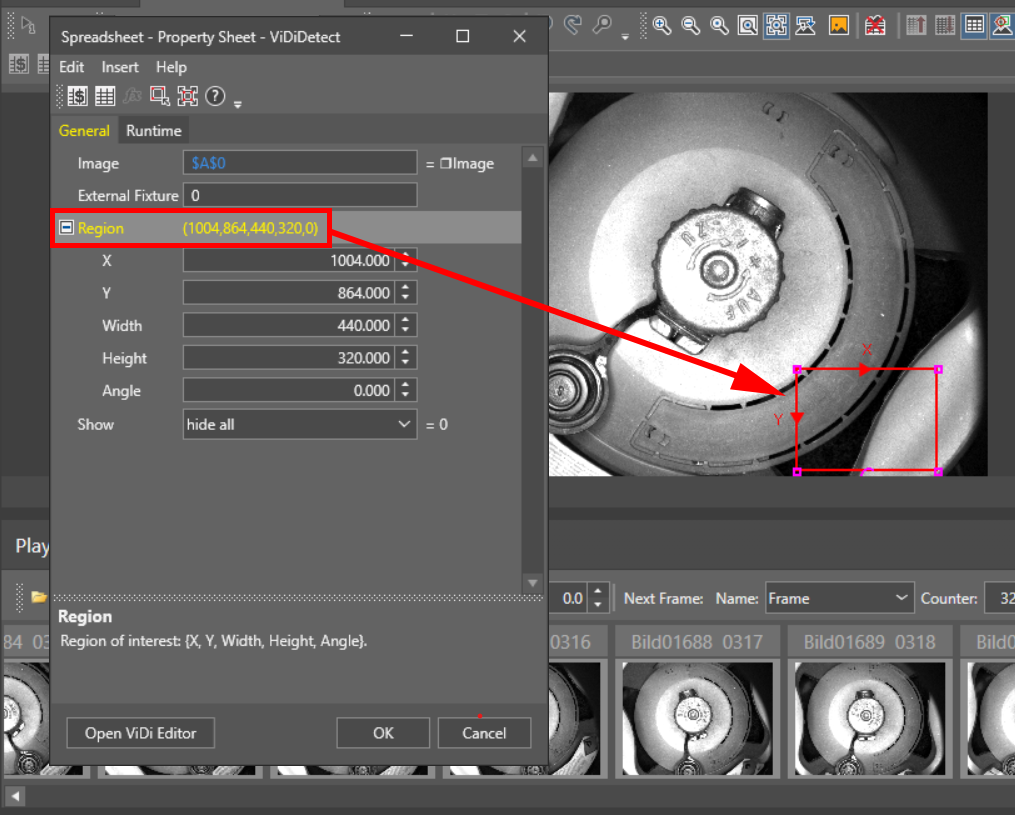
Set Region in the Property Sheet:
- Define the X and Y offset from the Fixture origin and the region width and height in pixels, and the rotation of the region compared to the Fixture X axis in degrees.
- Alternatively, double-click on Region and visually edit the region of interest.
- Click Open ViDi Editor in the Property Sheet to configure the ViDiDetect tool.
-
Add the images that you want to include in your training set by dragging and dropping from the filmstrip. The bigger the training set, the more reliable the results.
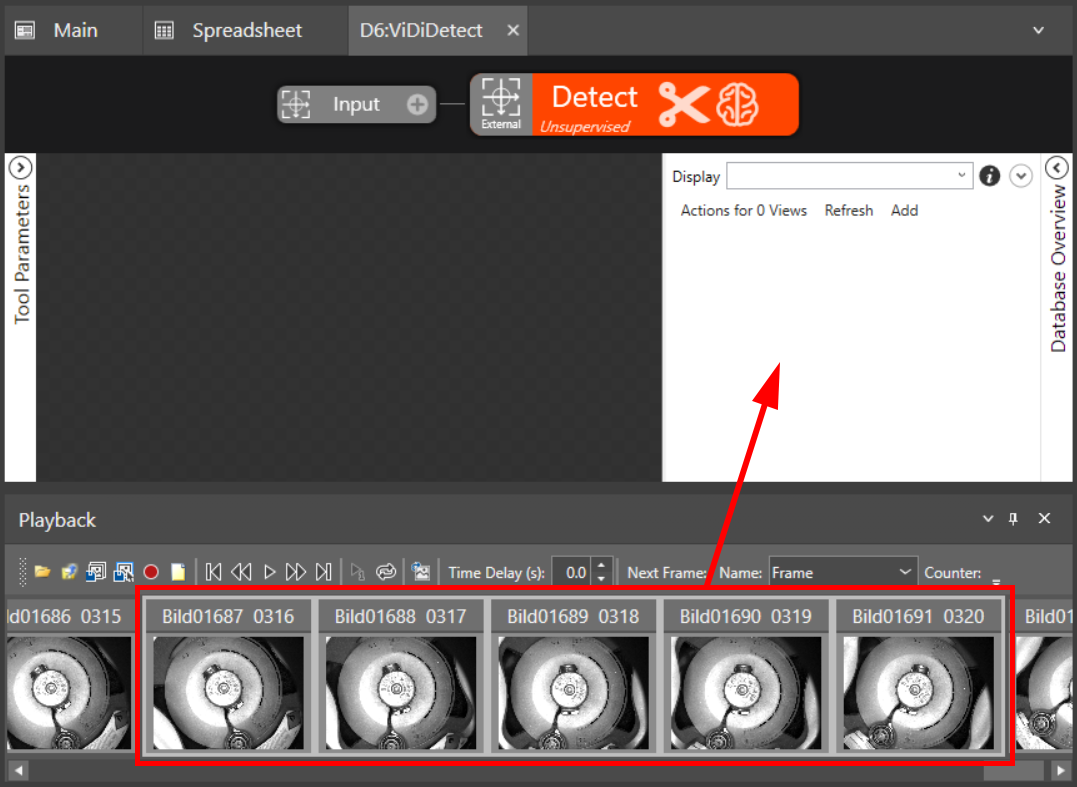
- Label the good images in your training set:
- Click on the image in the main display once to apply a Good label.
- Click on the image twice to apply a Bad label. This is not necessary for training the ViDiDetect tool.
- Click on the image a third time and confirm in the pop-up window to change a Bad label to Good.
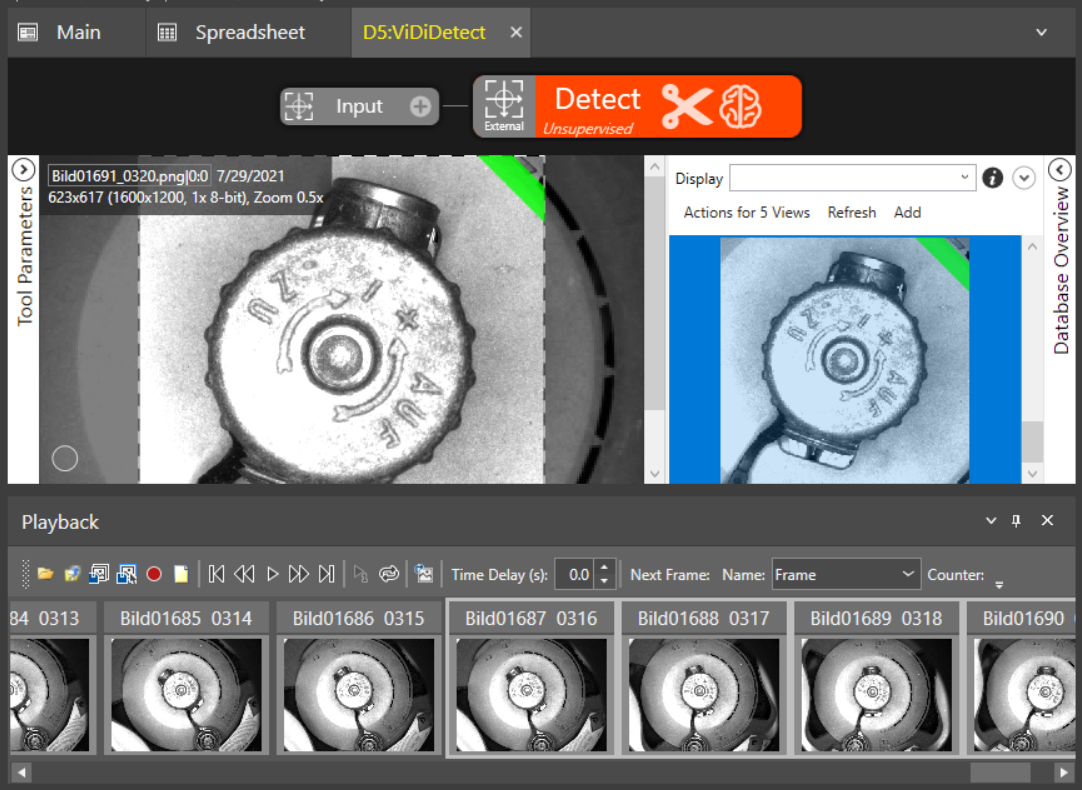
- Click the Brain icon to train the tool.
- Review your training images and verify that the results are correct.
- Use your testing images to qualify the results.
ViDiDetect Inputs
General Tab
| Parameter | Description | ||||||||||
|---|---|---|---|---|---|---|---|---|---|---|---|
|
Image |
This argument must reference a spreadsheet
cell that contains a valid Image data structure; by default, the cell references
A0, the cell containing the Image data structure returned by |
||||||||||
|
External Fixture |
Specifies a reference to a Fixture or Fixtures data structure. This fixture data is passed into the ViDi tools, and is used to define the views for each image. When using an external fixture, within the Region of Interest (ROI), select External. Then, from the Image Database menu, select Update All Training Fixtures, and modify the ROI of the ViDi tool. You can also update the ViDi tool reference to the external fixture data by right-clicking the ViDi data structure and selecting Update Training Fixtures. |
||||||||||
|
Region |
Also known as the Region of Interest (ROI), specifies the region of the image that undergoes analysis. Double-click on the Region parameter to create an Interactive Graphics Mode that you can transform and rotate. Select this parameter and press the Maximize Region button on the Job Edit toolbar of the property sheet to automatically stretch the region to cover the entire image.
|
||||||||||
|
Show |
Specifies the display mode for ViDiDetect tool's graphical overlays on top of the image.
|
Runtime Tab
Allows access to ViDi Processing Tool Parameters that can be modified while the job is online. These parameters do not require that the tool be retrained. You can drag and drop these parameter to the spreadsheet, and publish them to the HMI for operator interaction.
ViDiDetect Outputs
|
Returns |
A ViDiDetect data structure, containing the results of the trained tool. |
||||||||||||||||||||||||||||||||||||||||||||||||||||||||||||||||||||||||||||||||||
|
Results |
After the ViDiDetect tool has been trained, a result table can be generated, based on the ViDi Results Vision Data Access Functions, by right-clicking on the function's data structure and selecting Insert Getters. Note: When the Vision Data Access Functions are automatically generated, the default setting will auto-populate the first five features to the table. If there are more than five features, you will need to manually add them to the table. If you wish to display more entries, you can expand the table by copying the last row and pasting additional rows at the end; make sure to increment the index number of any newly-pasted row so that the proper feature is indexed.
|