Spreadsheet Editor – Charts
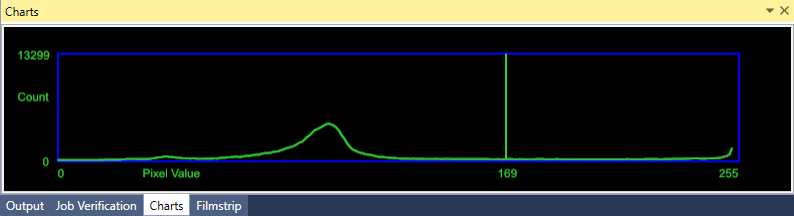
For Spreadsheet Vision Tools that generate a chart, the chart will open in a separate, dockable Charts tab of the Output Window. You can open this window either through the View > Charts option of theMenu Bar, or by clicking the Charts tab of the Output Window.
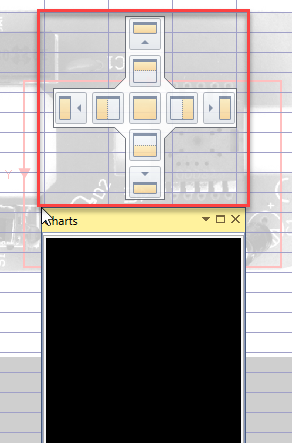
The Charts window can be undocked and dragged out of the IDE and moved to a new window (i.e. become a separate floating window). To reattach the undocked window to a particular part of the IDE, while dragging the window, choose one of the docking options.
When the function's Show parameter has been configured to display the chart, it will be displayed in the chart window and will automatically synchronize with the function.
If changes are made to the function generating the chart, the chart will automatically be updated to reflect the change.
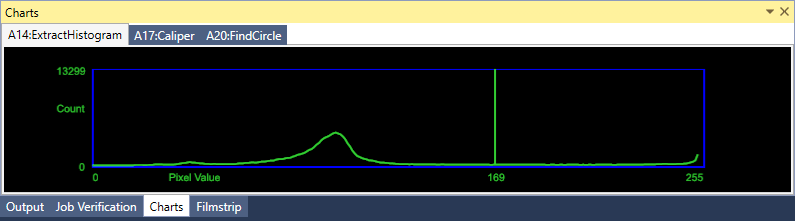
When there are multiple functions that generate charts in a spreadsheet, they will be tabbed. Selecting the function in the spreadsheet will change the chart window to display that function's chart, while selecting the chart in the chart window will select the function generating the chart in the spreadsheet.
The following Vision Tools generate a chart, along with the accompanying Show parameter setting:
-
The Show parameter of the Caliper function:

-
The Show parameter of the ExtractHistogram function:

-
The Show parameter of the FindCircle function:
-
The Show parameter of the FindCurve function:
-
The Show parameter of the FindLine function:
-
The Show parameter of the FindMultiLine function:
-
The Show parameter of the FindSegment function:
-
The Show parameter of the InspectEdge function:

-
The Show parameter of the InspectEdgeTrainBeadPath function:
