DetectBlobs
The DetectBlobs function performs a form of blob analysis known as "connectivity analysis" on a Region of Interest (ROI). For more information on ROI, see ROI.
During "connectivity analysis," the pixels within the ROI are divided into two categories, Blob or Background, based upon a greyscale Threshold value that separates all of the pixels below the threshold into a black category, and all of the pixels above the threshold into a white category. For more information on threshold, see Threshold.
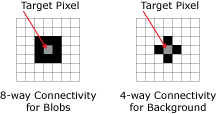
In this way, pixels with similar values are grouped together based upon their “color” and whether or not they “touch” their neighboring pixels. The Background pixels can be connected to their neighbors if the pixels touch on either side, above and below; while the Blob pixels can be connected to their neighbors if the pixels touch on either side, above, below or diagonally.
Once the image has been processed, it will have been segmented into Blob and Background pixel values. The Blobs found in the ROI will be identified based upon their physical characteristics and assigned values, such as the blob's location in the image (it's Row, Column coordinates), its area, perimeter, spread and elongation. The data from the extracted blobs is stored and reported in a Blobs data structure.
This function is the first step in blob analysis, and both FindBlobs and SortBlobs ultimately reference a DetectBlobs function's Blobs data structure, either directly or in a chain of cell dependencies. For more information, see FindBlobs and SortBlobs
DetectBlobs Inputs
Syntax: DetectBlobs(Image,Fixture.Row,Fixture.Column,Fixture.Theta,Region.X,Region.Y,Region.High,Region.Wide,Region.Angle,Region.Curve,External Region,Number to Sort,Threshold,Fill Holes,Boundary Blobs,Color Blob,Color Background,Area Limit:Min,Area Limit:Max,Show)
| Parameter | Description | |||||||||||||||||||||||
|---|---|---|---|---|---|---|---|---|---|---|---|---|---|---|---|---|---|---|---|---|---|---|---|---|
| Specifies a reference to a spreadsheet cell that contains an Image data structure; by default, this parameter references A0, the cell containing the AcquireImage Image data structure. This parameter can also reference other Image data structures, such as those returned by the Vision Tool Image functions or Coordinate Transforms Functions. | ||||||||||||||||||||||||
|
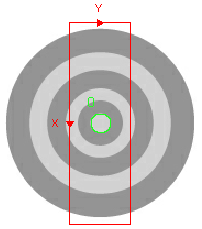
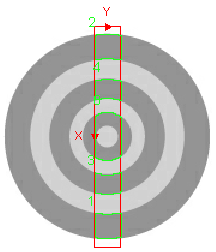
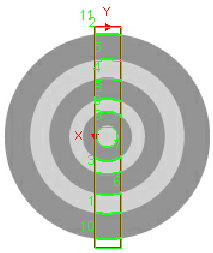
Defines the Region of Interest (ROI) relative to a Fixture input or the output of a Vision Tool function's image coordinate system. Setting the ROI relative to a Fixture ensures that if the Fixture is rotated or translated, the ROI will be rotated or translated in relation to the Fixture. For more information, see Fixture and Vision Tools. Note: The default setting is (0,0,0), the top leftmost
corner of the image.
|
||||||||||||||||||||||||
|
Also known as the Region of Interest (ROI), specifies the region of the image that undergoes analysis and creates a rectangular image region that can be transformed and rotated. For more information, see Interactive Graphics Mode. Tip: With this parameter
selected, you can press the Maximize
Region button on the property sheet's toolbar to maximize the region and cover the entire image.
|
||||||||||||||||||||||||
| External Region |
This parameter can reference a spreadsheet cell that contains the following functions:
When this parameter is used, the function ignores the Region and Fixture settings and inspects the image area specified by referenced region. If an EditCompositeRegion control is referenced, the inspection area can be a mix of shapes. Each shape in the composite region can be assigned as added to or subtracted from (masking) the inspection area. Note: If this parameter has been set as a reference to an external region, to use the function's internal Region, this parameter must be manually set to zero by entering the value 0 in place of the cell reference. Otherwise, the function will continue to reference the external region.
|
|||||||||||||||||||||||
|
Specifies the number of blobs to return.
Note: If the value
of the Number
to Sort parameter is greater than zero, DetectBlobs will automatically
insert a result table containing a maximum
of 10 entries that correspond to the first 10 blobs in the Blobs data structure. If you wish to display more entries, you
can expand the table by copying the last row and pasting additional rows
at the end; make sure to increment the index number of any newly-pasted
row so that the proper blob is indexed.
|
||||||||||||||||||||||||
|
Specifies the greyscale value that will be used to separate blobs from the background. This value can be determined by utilizing the DetectBlobs function's automatic setting (the default setting), manually configured through trial and error, or set as a reference to a Histogram function's calculated results. For more information, see Cell References - Relative/Absolute and Histogram.
|
||||||||||||||||||||||||
|
Specifies one of two methods for processing statistics accumulated in holes.
Note: Fill Holes for DetectBlobs is different than Fill Holes for ExtractBlobs, which reports holes within another blob when the Fill Hole checkbox is checked.
|
||||||||||||||||||||||||
|
Specifies one of two ways for managing blobs that intersect the ROI boundary.
|
||||||||||||||||||||||||
|
Specifies the blob's color.
Note:
|
||||||||||||||||||||||||
|
Specifies the background color in the acquired image. 8-way connectivity analysis is performed on the foreground, and 4-way connectivity is performed on the background.
|
||||||||||||||||||||||||
|
Specifies a minimum area restriction, in number of pixels, for all returned blobs (default = 100); only blobs whose area is greater than the Area Limit: Min value will be returned. The parameter range is:
For example, when connected to the In-Sight 7802 vision system, the parameter range is 0 to 1,920,000 (1600x1200). |
||||||||||||||||||||||||
|
Specifies a maximum area restriction, in number of pixels, for all returned blobs (default = 100000); only blobs whose area is less than the Area Limit: Max will be returned. The parameter range is:
For example, when connected to the In-Sight 7802 vision system, the parameter range is 0 to 1,920,000 (1600x1200). |
||||||||||||||||||||||||
|
Specifies the display mode for DetectBlobs graphical overlays on top of the image.
|
DetectBlobs Outputs
|
Returns |
A Blobs data structure containing the blobs extracted from the image, or #ERR if any of the input parameters are invalid. |
|
When DetectBlobs is initially inserted into a cell, a result table is created in the spreadsheet. If Number to Sort is equal to 0, the table is comprised solely of the GetNFound function. If Number to Sort is greater than zero, multiple functions will be inserted to create a table of blob results with a maximum of Number to Sort rows.
Note: If the value
of the Number
to Sort parameter is greater than zero, DetectBlobs will automatically
insert a result table containing a maximum
of 10 entries that correspond to the first 10 blobs in the Blobs data structure. If you wish to display more entries, you
can expand the table by copying the last row and pasting additional rows
at the end; make sure to increment the index number of any newly-pasted
row so that the proper blob is indexed.
|
DetectBlobs Vision Data Access Functions
These functions provide important statistical information about the blobs found in the image.
The following Vision Data Access functions are automatically inserted into the spreadsheet to create the DetectBlobs Blobs data structure result table:
| Spreadsheet Function |
Function Name |
Description |
|---|---|---|
|
Index |
N/A |
Returns the indexed blobs, sorted from largest to smallest in area. |
|
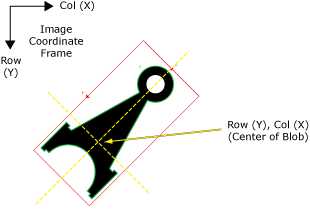
Row |
GetRow(Blobs, Blob Index) |
Returns the y-coordinate (Row) of a blob's center of mass (centroid). |
|
Col |
GetCol(Blobs, Blob Index) |
Returns the x-coordinate (Column) of a blob's center of mass (centroid). |
|
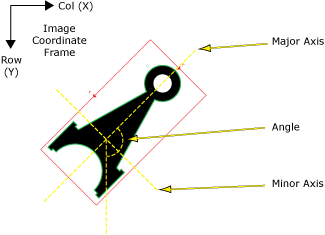
Angle |
GetAngle(Blobs, Blob Index) |
Returns the angle of a blob’s principal (major) axis with respect to the Y-axis. Note: The Angle value on rectangles may be reported 180 degrees different from that of ExtractBlobs.
|
|
Color |
GetColor(Blobs, Blob Index) |
Returns the color value (0 = black, 1 = white) of a blob. |
|
Score |
GetScore(Blobs, Blob Index) |
A measure of how closely the blob matches the criteria of a FindBlobs function. |
|
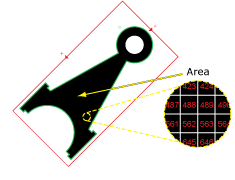
Area |
GetArea(Blobs, Blob Index) |
Returns the area of the blob (measured in pixels). Note: If there are
holes in the blob, the Area value
will vary depending on whether or not the Fill Holes checkbox is enabled
or disabled.
|
|
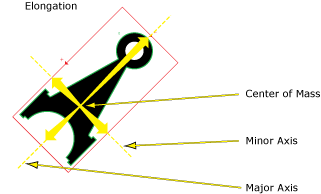
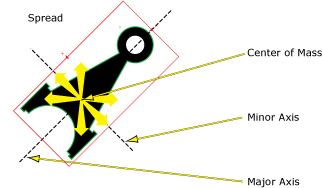
Elongation |
GetElongation(Blobs, Blob Index) |
Returns a value that represents how a blob's pixels are stretched out from the blob's center of mass (centroid). For instance, a circle would report 0 Elongation, while a nail would have a high Elongation value. |
|
Holes |
GetHoles(Blobs, Blob Index) |
Returns the number of holes contained within the blob. Note: Only holes whose area is greater
than the Area Limit: Min
value will be returned.
|
|
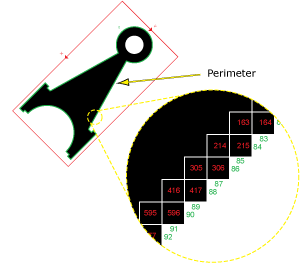
Perimeter |
GetPerimeter(Blobs, Blob Index) |
Returns the length of the boundary around the blob; the perimeter is calculated by counting the external edges of the pixels that form the boundary of the blob. |
|
Spread |
GetSpread(Blobs, Blob Index) |
Returns a value that represents how a blob's pixels are distributed away from the blob's center of mass (centroid). For instance, a circular shaped object would have a lower Spread value than an oval shaped object. |
For more information on Vision Data Access functions, see Blobs.
DetectBlobs Example
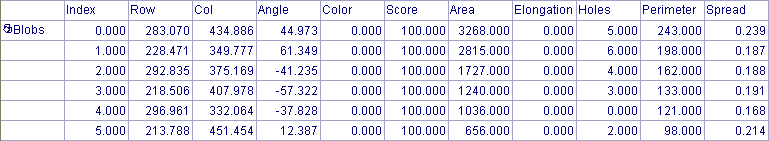
The DetectBlobs function is used to identify and locate blobs of connected pixels, which can be comprised of various shapes and sizes. This example illustrates how the information returned in the DetectBlobs data structure result table relates to the found blobs, and how that information can be used to later sort and filter the blobs based upon their characteristics.
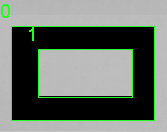
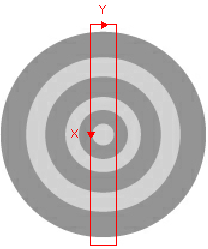
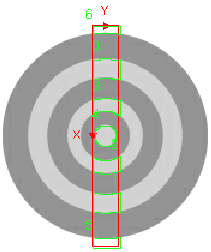
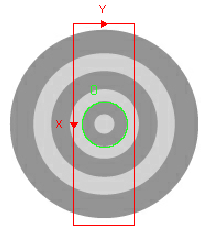
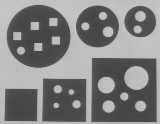
For this example, the following image has been used to help illustrate the meaning of the values that are returned in the DetectBlobs function's result table:
An DetectBlobs function was inserted into a blank cell in the spreadsheet.
Based upon the shapes, the ![]() DetectBlobs property sheet's
parameters were configured as follows:
DetectBlobs property sheet's
parameters were configured as follows:
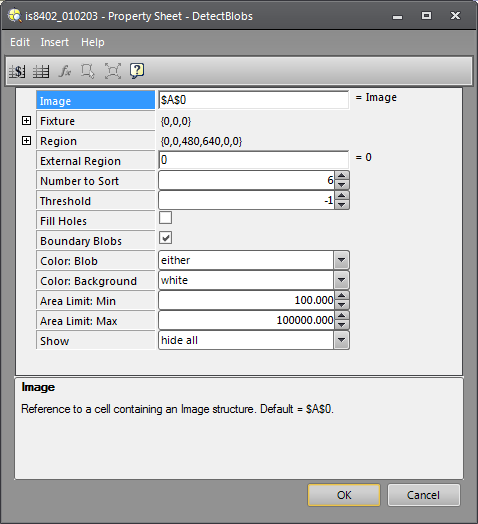
- Image: The default setting was used for this example, but this parameter can reference any Image data structure, such as an Image data structure produced by a Filter function, which processes the image to remove excess image noise before inspecting it for blobs.
- Fixture: The default setting was used because the image is stationary and will not be rotated or moved. However, when using the DetectBlobs function on images that undergo movement, it is advisable to assign the image region to a Fixture.
- Region: The image region was maximized to include all of the shapes in the analysis. By clicking on the Region parameter and then pressing the Maximize Region button on the property sheet's toolbar, the region will automatically be stretched to cover the entire image.
- Number to Sort: The Number to Sort was set to six. This parameter could have also been set to 0, and the tool would have automatically extracted all blobs that meet the color and size settings specified in the Color Blob/Color Background and Area Limit: Min/Area Limit: Max parameters.
- Threshold: The default setting was used, which automatically calculates the greyscale Threshold value. In this image, the greyscale value differences are very pronounced and it is very clear which pixels are the dark pixels and which are the light. In applications where there is a more subtle gradation and the automatic threshold setting does not separate the values very well, using Histogram functions, such as the HistHead or HistTail functions, to determine the greyscale intensities in different regions of the image can be very helpful.
- Fill Holes: The default setting was used, enabling the contribution of the holes found in the blobs, thus decreasing the overall area of those blob shapes with holes in them. Had the Fill Holes checkbox been checked, holes within blobs are reported and the area within the holes would have been added, thus increasing the area of the blobs with holes.
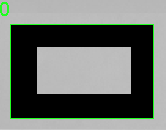
- Boundary Blobs: The default setting was used, which includes any blobs that intersect the image region's boundary. With this setting, if the image had been moved to the left, and the biggest circle and the smallest square shape intersected the left-most boundary of the image region, the parts of those shapes that still fell within the region's boundary would be extracted as blobs. If the checkbox had been unchecked, though, those blobs would not have been processed.
- Area Limit: Min/Max: The default settings were used. These settings filter through the blobs in the region during the extraction phase, evaluating the blobs based upon the minimum and maximum area limit settings to determine whether or not the area of the blob allows it to be classified as a blob.
- Show: The default setting was used, which only allows the result graphics to be displayed when the cell containing the Blobs data structure is selected, as in the example below.
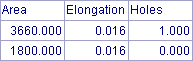
After configuring the DetectBlobs property sheet, a Blobs data
structure and ![]() result data table
are produced.
result data table
are produced.
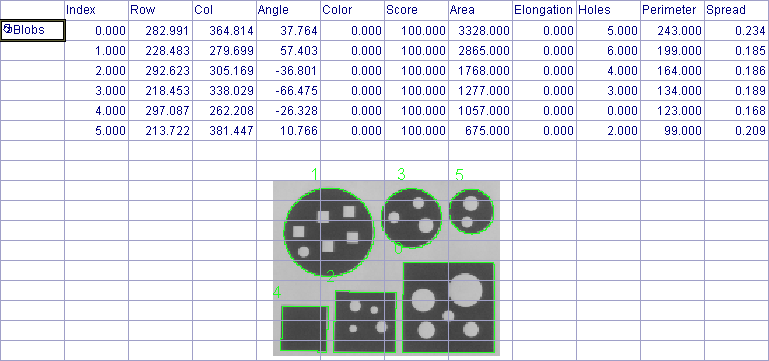
The values returned in the result table can be used to filter and sort the blobs, using the FindBlobs and SortBlobs functions. For example, a FindBlobs function could be inserted into the spreadsheet and reference the DetectBlobs function. The FindBlobs function would then be used to filter the blobs based upon their Spread. Then a SortBlobs function could be inserted into the spreadsheet and it could reference the recently created FindBlobs function to sort the list of blobs based upon their X,Y position.