InspectEdgeTrainBeadPath
The InspectEdgeTrainBeadPath function is used to find the center of an edge-based bead feature, and creates a polyline that traces the path of the detected bead path. The polyline path created by the tool can be used as an input by other InspectEdge Functions, such as the InspectEdgeWidth function, to determine if there are positional defects, width defects or gaps in the bead.
InspectEdgeTrainBeadPath Overview
A bead path is a continuous pair of edges that define the boundary between two regions of different pixel values (the path does not always have to appear as loop). Typically, a bead path refers to an ink or glue path, or a welded seam, which is defined by its width, or thickness, and its location. The InspectEdgeTrainBeadPath function, in conjunction with the other InspectEdge functions, provides the ability to be applied in bead tracking applications, where the bead path varies from one image to the next, or verifying whether or not a bead path is consistently in the same location.
In the bead tracking application, the InspectEdgeTrainBeadPath function, in conjunction with an InspectEdge function and InspectEdgeWidth function, is capable of verifying that the bead path is consistently laid out in a uniform pattern, neither too thick or thin. The functions create a multi-segmented line that defines a path along the bead, and then determines if there any areas of the bead path which are too thick, thin, or missing altogether.
In the location-based bead tracking application, the same functions are capable of verifying that the bead path is consistently in the same location, with the same thickness, and that there are no positional variations along the path.
InspectEdgeTrainBeadPath Inputs
| Parameter | Description | ||||||||||||||||||||||
|
Image |
This parameter must reference a spreadsheet cell that contains an Image data structure; by default, this parameter references A0, the cell containing the AcquireImage data structure. This parameter can also reference other Image data structures, such as those returned by the Image Vision Data Access Functions or Coordinate Transforms Functions. |
||||||||||||||||||||||
|
Fixture |
Defines the Region of Interest (ROI) relative to a Fixture input or the output of a Vision Tools function's image coordinate system. Setting the ROI relative to a Fixture ensures that if the Fixture is rotated or translated, the ROI will be rotated or translated in relation to the Fixture. The default setting is (0,0,0), the top leftmost corner of the image.
|
||||||||||||||||||||||
|
Region |
Also known as the Region of Interest (ROI), specifies the region of the image
that undergoes edge analysis; creates a Rectangle Regions Interactive Graphics Mode that can be transformed and rotated. With this parameter
selected, by pressing the Maximize
Region
|
||||||||||||||||||||||
|
Note: The Fixture and Region parameters must be defined
within the bounds of the image; otherwise, the function will return #ERR.
|
|||||||||||||||||||||||
|
External Region or Path |
Specifies Cell References to a spreadsheet cell that contains an Annulus, a Region, an EditAnnulus, an EditMaskedRegion, an EditPolylinePath or an EditRegion function. When this parameter is used, the function ignores the Region and Fixture settings and inspects the image area specified by the referenced region.. Note:
|
||||||||||||||||||||||
|
Caliper |
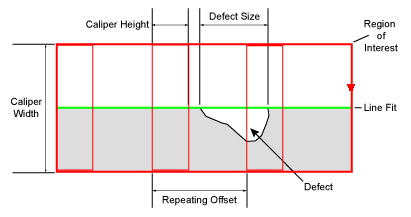
Specifies the Caliper array within the ROI that will be used to define the size of the detectable defects and/or gaps. The size of the detectable defect or gap is determined by the number of edges that can be detected, which is determined by the number of Calipers placed along the edge. The Calipers are displayed within the ROI as red rectangles, and edges detected within the Caliper are displayed in green, when the InspectEdge cell is highlighted or the Show parameter is set to show all. Note: Depending on the type of defect being examined, Calipers may be positioned to overlap. However, the more Calipers that are applied within the ROI will increase the function's execution time.
|
||||||||||||||||||||||
|
Minimum Contrast |
Specifies the minimum greyscale contrast transition (0 to 255; default = 5) to be considered an edge. For each indexed Caliper, an edge response chart is displayed with the image. The values in the chart are automatically scaled to a 0-100 value. Utilize this chart when applying this parameter to properly adjust the value. Example - Minimum Contrast Parameter with Chart Note: The edge response chart is a dockable window. For more information, see the Spreadsheet Editor – Charts topic.
|
||||||||||||||||||||||
|
Edge Width |
Specifies the pixel distance (1 to the Region width value; default = 3) over which an edge transition takes place. This setting is the approximate size of the pixel operator used to filter the greyscale projections before edges are extracted; use this setting to filter noise from the image. |
||||||||||||||||||||||
|
Fit All Calipers |
Specifies whether or not all of the Calipers are placed within the ROI.
|
||||||||||||||||||||||
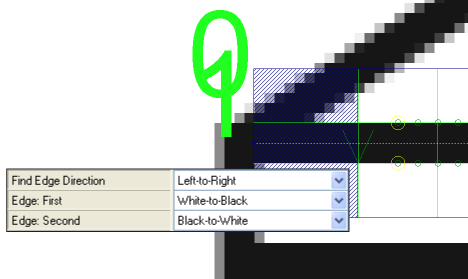
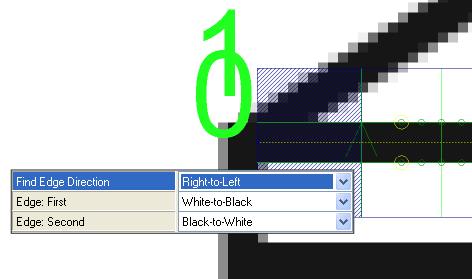
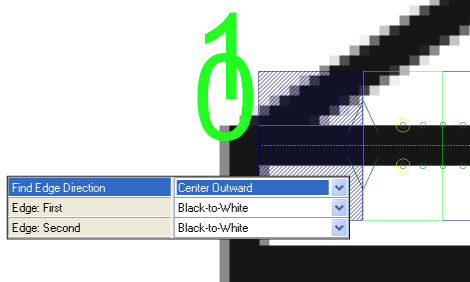
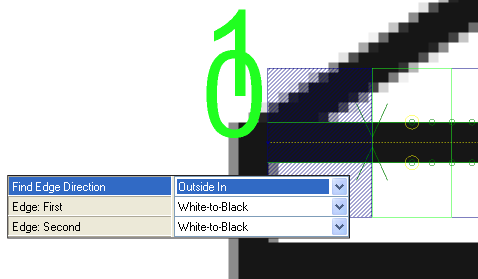
| Find Edge Direction |
Specifies the direction in which the function will attempt to detect edges. Dark green arrows are added to graphically illustrate the direction in which the edge will be detected. Fit lines will be labeled graphically within the image, with the first fit line being labeled 0, and the second fit line being 1.
|
||||||||||||||||||||||
| Edge: First |
Specifies the contrast transition of the first edge to be detected, as determined by the Find Edge Direction parameter.
|
||||||||||||||||||||||
| Edge: Second |
Specifies the contrast transition of the second edge to be detected, as determined by the Find Edge Direction parameter.
|
||||||||||||||||||||||
|
Edge Scoring |
Specifies the edge scoring mode that will be used to determine whether or not an edge meets the established criteria.
|
||||||||||||||||||||||
| Train |
Specifies the training mode of the tool.
|
||||||||||||||||||||||
|
Caliper Graph Index |
Specifies the Caliper to be displayed on the image (the Caliper will be outlined in green); default Caliper displayed is 0. |
||||||||||||||||||||||
|
Show |
Specifies the display mode for InspectEdge graphical overlays on top of the image.
|
||||||||||||||||||||||
 button on the property sheet's toolbar, the region will automatically
be stretched to cover the entire image. The dashed yellow line indicates the direction in which the edge will be found.
button on the property sheet's toolbar, the region will automatically
be stretched to cover the entire image. The dashed yellow line indicates the direction in which the edge will be found.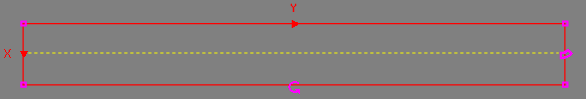
InspectEdgeTrainBeadPath Outputs
|
Returns |
An Inspect data structure containing the detected edges in the image and the number of Calipers, or #ERR if any of the input parameters are invalid. |
|
Results |
The number of Calipers in the ROI. |