Interpret Results
Once it was trained and processed, the results of a tool are calculated against all views. But, the results should only be reviewed on the test set for correct evaluation of a tool.
Test Set: The Images for Result Evaluation
Statistical measurements within VisionPro Deep Learning are used to evaluate the trained neural network's performance. Within the deep learning paradigm, evaluation refers to the process of evaluating a trained neural network model against a test data (the data labeled by the user but not used in training). So, if you want to determine availability and performance of a neural network model through statistical metrics, these metrics must be calculated only on the test data.
It is important to understand that after training of your neural network model, which means your tool (Blue Locate/Read, Green Classify, or Red Analyze), if you want to check out how the model is well trained, you are not allowed to test the model against the data used for training this model. The training data cannot be employed in the evaluation of a trained model because the model was already fitted to this data during training, to make the best performance given the training data set. So, this data cannot tell how the model generalizes well enough and also desirably performs when it meets unseen, fresh data.
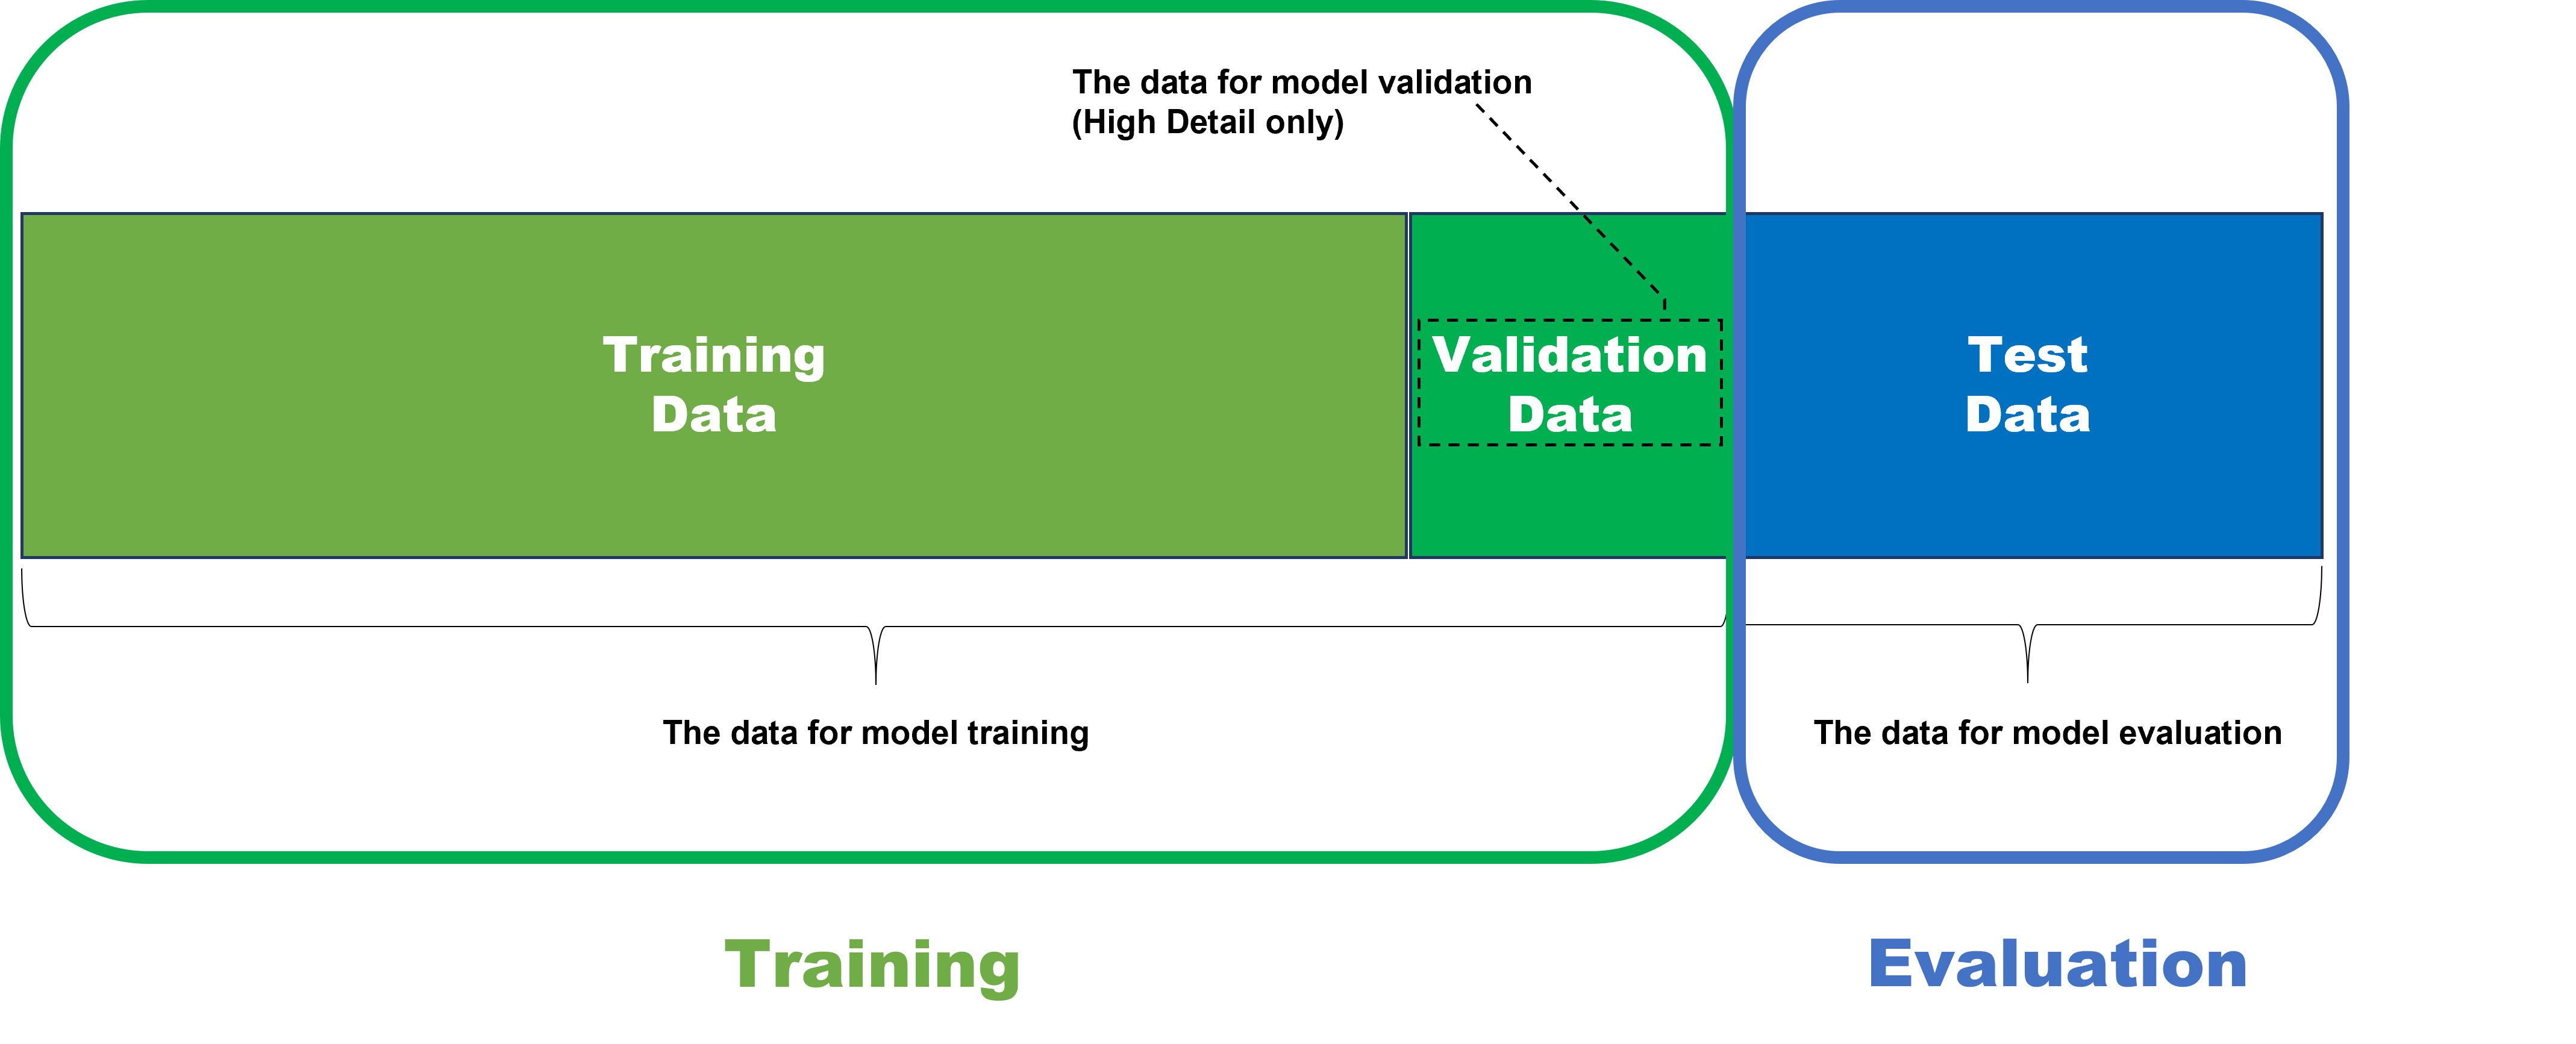
Therefore, to test the model's availability and performance fairly and correctly, the model should be applied to the data that it has never seen before including its training phase. That is why the data for model evaluation is called test data set.
Database Overview
The Database Overview pane provides information about the images and views used for training, and access to the Statistics output by the Cognex Deep Learning Tools. This pane changes its display, depending on the tool selected.
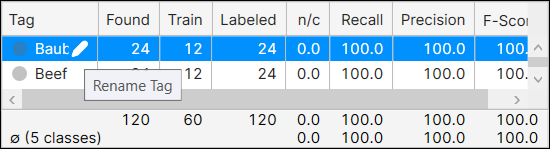
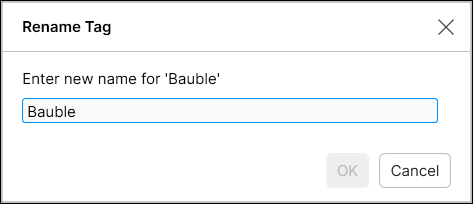
You can rename tags by clicking the name, and then pressing the pencil icon to launch the Rename Tag dialog.
While in Expert Mode, you can utilize the Filter field to separate images/views, and perform statistical analysis on just those images/views. See Display Filters and Filters for information on the syntax to filter images/views, and the Testing Image Sample Set topic for more information on possible usages of the filter.
Processing Time
Individual tool processing time is displayed in the Database Overview, as shown below:
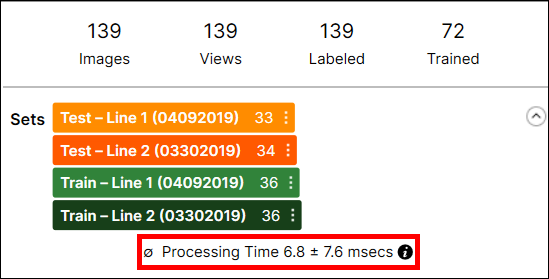
Processing Time is the average processing time per image in the last processing task, and it is the sum of the processing time and the post-processing time. The processing time for a stream containing multiple tools is not available through the VisionPro Deep Learning GUI, and you cannot estimate it by summing the tool execution time of the tools in the stream because the processing time includes the time required to prepare and transmit view information between tools.
Result Metrics
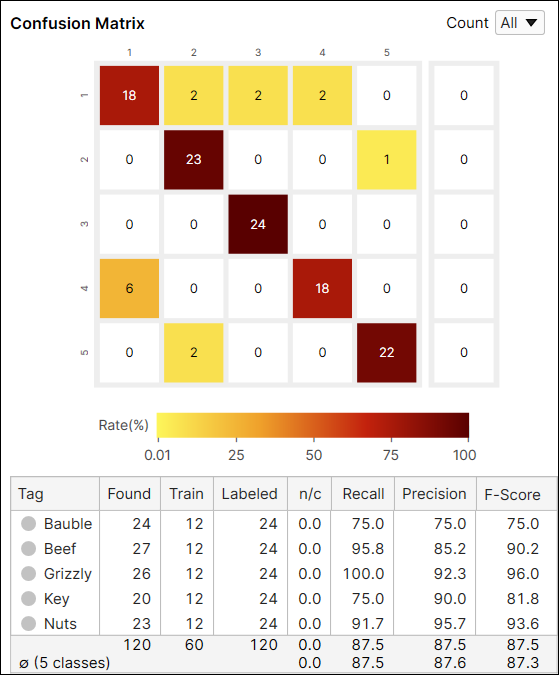
The statistics for the Green Classify tool contain the Recall, Precision, and F-Score values. It also includes an interactive Confusion Matrix (visible in the Database Overview).

The metrics output by the Green Classify Focused is given:
- Confusion Matrix
- Precision, Recall and F-Score
Basic Concepts: False Positives, False Negatives
In addition to the Statistical Results components, it is also important to understand how they affect False Positive and False Negative results.
Assume that there is an image inspection system that is built for capturing defects in images. If it captures one or more defects in an image, let's say the inspection result for that image is Positive, and if it captures no defect at all, the inspection result for that image is Negative. Then, the statistical results of the inspection task can be summarized into the followings:
-
False Positive (also known as a Type I Error)
-
An inspection system identifies a class of an image, but this image does not actually belong to that class.
-
-
False Negative (also known as a Type II Error)
-
An inspection system could not identify a class of an image, but this image should have been identified as belonging to that class.
-
Basic Concepts: Precision, Recall, F-Score
The False Positives and False Negatives are then summarized and represented again using the following metrics, which are the Precision and Recall, the statistical results used in all VisionPro Deep Learning tools.
- Precision
- A neural network with a low Precision typically fails to correctly classify the images (test data) that should have been correctly classified, and so it returns many False Positive judgments (Type 1 Errors).
- A neural network with a high Precision typically succeeds to correctly classify the image data (test data), but if combined with low Recall, there is a possibility yet that there could be many False Negative judgments (Type 2 Errors)
- Recall
- A neural network with a low Recall typically fails to sufficiently classify the images (test data) that should have been classified, and so it returns many False Negative judgments (Type 2 Errors).
- A neural network with a high Recall typically succeeds to sufficiently classify the images (test data), but if combined with low Precision, there is a possibility yet that there could be many False Positive judgments (Type 1 Errors)
To sum up,
- Precision - The percentage of detected classes that match the labeled class.
- Recall - The percentage of labeled classes that are correctly identified by the tool.
- F-Score - The harmonic mean of Recall and Precision.
The ideal statistical results for almost all inspection cases (there could be exceptional cases) includes high Precision and high Recall at the same time.
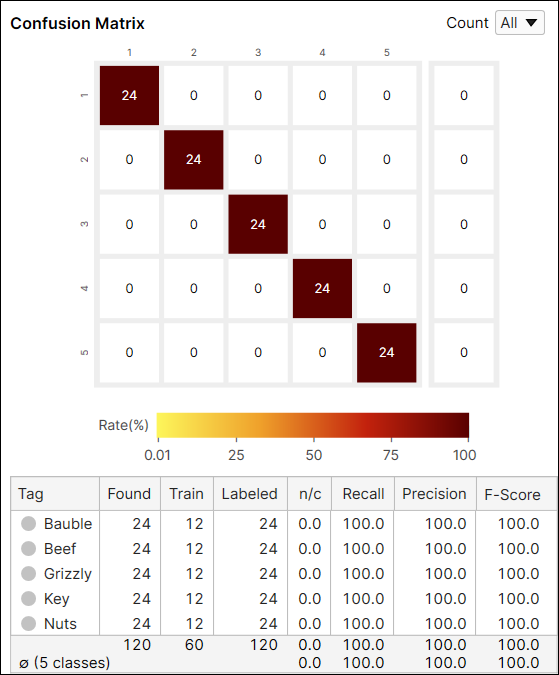
Confusion Matrix for Green Classify
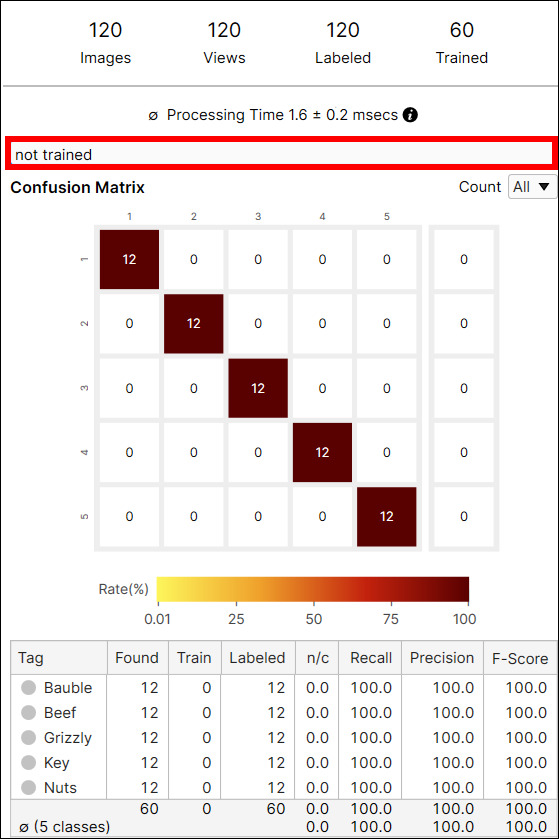
The Confusion Matrix is a visual representation of the ground truth versus the tool's predictions. The Confusion Matrix of the Green Classify tool is a graphical representation of the Recall and Precision scores. The confusion matrix on the left side is the representation of the right table. If you click each circle at the Confusion Matrix on Database Overview, the corresponding item (views) in each cell of the table will be displayed on the View Browser.
|
Predicted Class |
||||||
|
Bauble |
Beef |
Grizzly |
Key |
Nuts |
||
|
Actual Class |
Bauble |
18 |
2 | 2 | 2 | |
|
Beef |
23 |
1 |
||||
|
Grizzly |
24 |
|||||
|
Key |
6 |
18 |
|
|||
|
Nuts |
2 |
22 |
||||
The color of a confusion matrix cell stands for the ratio of the number of predicted views (the value of a cell) to the total number of labeled views (the row sum). The darker color means the higher ratio and the lighter means the opposite.
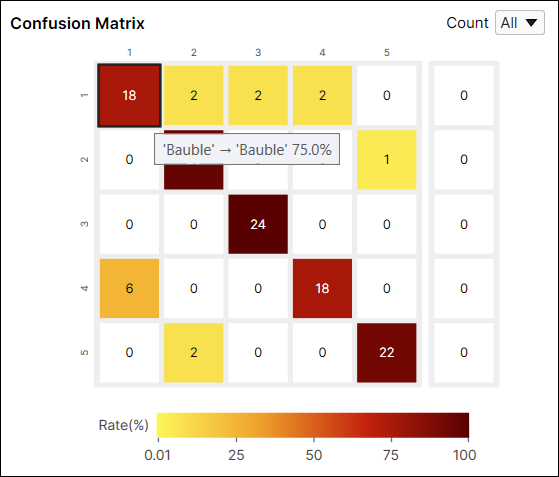
For example, the color of the cell at the index (1,1) is dark red because among the views whose label is 'Bauble' the number of views classified as 'Bauble' is 18 and it accounts for 75% (18/24) of the views whose label is 'Bauble.'
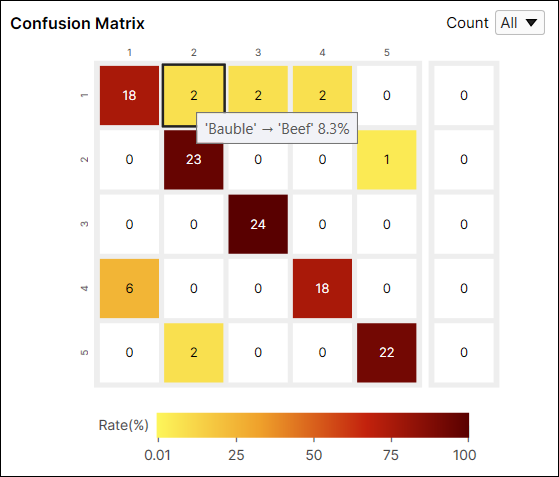
For another example, the color of the cell at the index (1,2) is yellow because among the views whose label is 'Bauble' the number of views classified as 'Beef' is 2. The number of views classified as 'Beef' accounts for 8.3% (2/24) of the views whose label is 'Bauble.'
It is generally recommended that the darker cells are placed at the diagonal indices of a confusion matrix because it represents the desirable results.
|
|
|
| Good Performance |
Poor Performance |
Variables in Confusion Matrix Table
| Variable | Description |
| Tag | The class label. |
| Found | The total number of the views classified (predicted, marked) as this class. |
| Train | The total number of the views labeled as this class and included in the training set. |
| Labeled | The total number of the views labeled as this class. |
| n/c (Not classified) |
The proportion of the views that are not in the training set and whose scores (class probabilities) are under the threshold. |
| Recall |
The percentage of the correctly classified views among the views that are labeled as this class and that are not in the training set. See the section below for the details. |
| Precision | The percentage of the correctly classified views among the views that are classified as this class and that are not in the training set. See the section below for the details. |
| F-Score | The harmonic mean of the precision and recall calculated above. |
Confusion Matrix Calculation: All Views vs Untrained Views
The Count option in the Confusion Matrix provides the result of the current tool calculated from all views (All), or only from the views that are not included in the training set (Untrained Views). You can switch the results between the one generated from every view including training and test images, and only from the untrained views which are the test images.
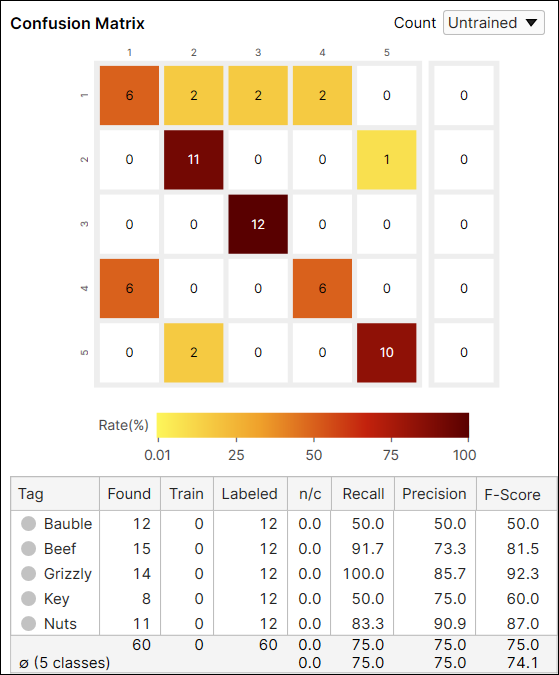
Precision, Recall, F-Score for Green Classify
The precision and recall are calculated with the data that is not used for training the tool. F-Score is the harmonic mean of the precision and the recall and that being so it is also based on the data that are not in the training set. You can manually figure out the same values as the ones in the Confusion Matrix table using Display Filter.
|
Predicted Class |
||||||
|
Bauble |
Beef |
Grizzly |
Key |
Nuts |
||
|
Actual Class |
Bauble |
18 |
2 | 2 | 2 | |
|
Beef |
23 |
1 |
||||
|
Grizzly |
24 |
|||||
|
Key |
6 |
18 |
|
|||
|
Nuts |
2 |
22 |
||||
-
Precision calculation example for the class "Beef" (Display Filter Syntax)
-
True Positives: best_tag='Beef' and tag![name='Beef'] and not trained
-
False Positives: best_tag='Beef' and tag![name!='Beef'] and not trained
-
Precision = True Positives / (True Positives + False Positives)
-
-
Recall calculation example for the class "Beef" (Display Filter Syntax)
-
True Positives: best_tag='Beef' and tag![name='Beef'] and not trained
-
False Negatives: best_tag!='Beef' and tag![name='Beef'] and not trained
-
Recall = True Positives / (True Positives + False Negatives)
-
-
F-Score calculation example for the class "Beef"

Precision Calculation
For the Green Classify tool, Precision is calculated as the percentage of detected classes that match the labeled class.
The tool calculates Precision as the percentage of correctly classified views predicted as class i:

For example, a Precision of 90% for the class "Breast" means that the neural network will confuse an image of chicken breasts with a different class 1 out of 10 times.
|
Predicted Class |
|||||||||||
|
Breast |
Drumstick |
Filet |
Flaps |
Leg |
Neck |
Skewer |
Sliced Breast |
Thigh |
Wings |
||
|
Actual Class |
Breast |
19 |
1 |
||||||||
|
Drumstick |
14 |
2 |
2 |
2 |
|||||||
|
Filet |
20 |
||||||||||
|
Flaps |
19 |
1 |
|||||||||
|
Leg |
18 |
||||||||||
|
Neck |
2 |
17 |
|||||||||
|
Skewer |
1 |
13 |
|||||||||
|
Sliced Breast |
4 |
4 |
14 |
||||||||
|
Thigh |
1 |
2 |
16 |
||||||||
|
Wings |
20 |
||||||||||
Recall Calculation
For the Green Classify tool, the Recall is a percentage of the labeled classes that are correctly identified by the tool.
The tool calculates Recall by the fraction of classified views labeled as class i that are correctly classified as class i:

For example, a Recall of 90% for the class "Breast" means that the neural network will correctly classify an image of chicken breasts 9 out of 10 times.
|
Predicted Class |
|||||||||||
|
Breast |
Drumstick |
Filet |
Flaps |
Leg |
Neck |
Skewer |
Sliced Breast |
Thigh |
Wings |
||
|
Actual Class |
Breast |
19 |
1 |
||||||||
|
Drumstick |
14 |
2 |
2 |
2 |
|||||||
|
Filet |
20 |
||||||||||
|
Flaps |
19 |
1 |
|||||||||
|
Leg |
18 |
||||||||||
|
Neck |
2 |
17 |
|||||||||
|
Skewer |
1 |
13 |
|||||||||
|
Sliced Breast |
4 |
4 |
14 |
||||||||
|
Thigh |
1 |
2 |
16 |
||||||||
|
Wings |
20 |
||||||||||
F-Score Calculation
For the Green Classify tool, the F-Score provides a harmonic mean of Recall and Precision values. The F-Score tends to be the best measure of the overall accuracy of the tool.

To optimize the tool, consider the following:
- To avoid False Positives absolutely, target a Precision score of 100
- To avoid False Negatives absolutely, target a Recall score of 100
Otherwise, target the following:
- For unbalanced problems where sparse classes matter, go by the F-Score.
- Use the F-Score averaged over all classes.
- Set the Threshold Processing parameter to 0% to avoid a varying rate of non-classified views.
Non-Exclusive Mode (Multi Class) Statistics
Once it was trained and process, the results of non-exclusive Green Classify Focused tool are calculated by each class. This means that the recall, precision, and the f-score is calculated per class. Like Green Classify Focused in exclusive mode, the recall, precision, and the f-score are calculated in the sense that True Positives, True Negatives, False Positives, False Negatives are calculated based upon "best_tag," which is the class that has the highest probability among all classes.