Interpret Results
Once it was trained and processed, the results of a tool are calculated against all views. But, the results should only be reviewed on the test set for correct evaluation of a tool.
Test Set: The Images for Result Evaluation
Statistical measurements within VisionPro Deep Learning are used to evaluate the trained neural network's performance. Within the deep learning paradigm, evaluation refers to the process of evaluating a trained neural network model against a test data (the data labeled by the user but not used in training). So, if you want to determine availability and performance of a neural network model through statistical metrics, these metrics must be calculated only on the test data.
It is important to understand that after training of your neural network model, which means your tool (Blue Locate/Read, Green Classify, or Red Analyze), if you want to check out how the model is well trained, you are not allowed to test the model against the data used for training this model. The training data cannot be employed in the evaluation of a trained model because the model was already fitted to this data during training, to make the best performance given the training data set. So, this data cannot tell how the model generalizes well enough and also desirably performs when it meets unseen, fresh data.
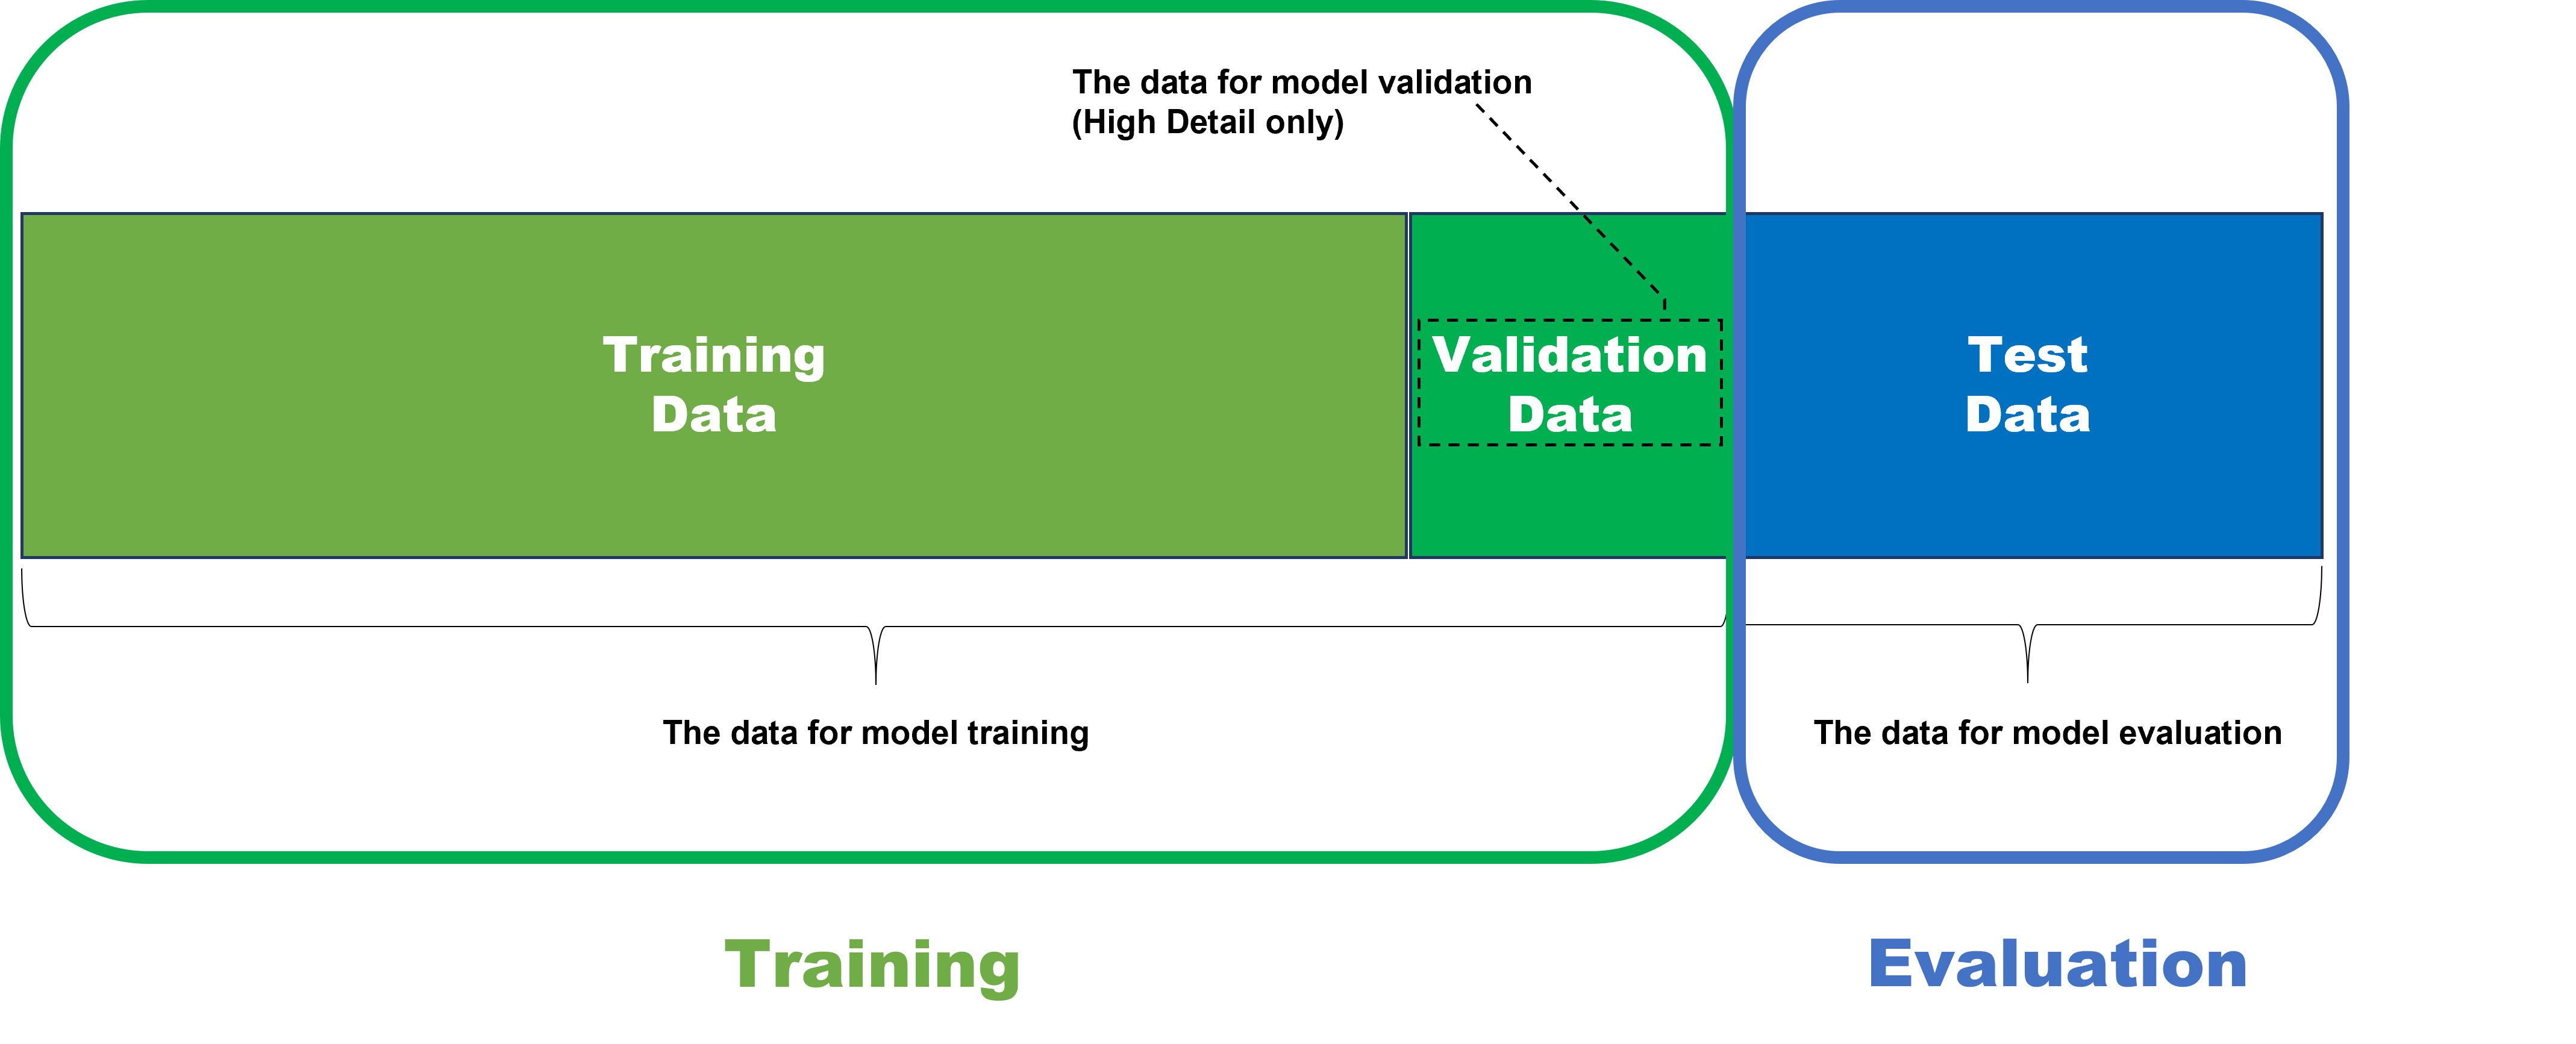
Therefore, to test the model's availability and performance fairly and correctly, the model should be applied to the data that it has never seen before including its training phase. That is why the data for model evaluation is called test data set.
Note that the test data set is out of training scope while the validation data set is included in the training phase. The validation data is part of the training set and its purpose is among many models generated from the training data choosing the best model as the final output of training. For High Detail modes, the validation loss (=the loss calculated from the validation data) is calculated for each model during the training phase, and the model who gives the best loss in terms of performance and availability is finally selected as the result of training. Again, the validation data is only used in the Green Classify and Red Analyze High Detail modes. The tools with the other modes of operation do not use the validation data and so they choose the best model with the loss calculated from the training data.
Database Overview
The Database Overview pane provides information about the images and views used for training, and access to the Statistics output by the Cognex Deep Learning Tools. This pane changes its display, depending on the tool selected.
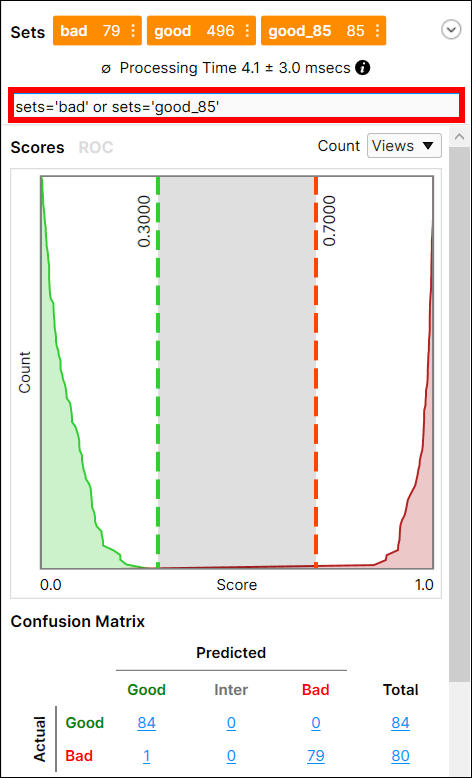
While in Expert Mode, you can utilize the Filter field to separate images/views, and perform statistical analysis on just those images/views. See Display Filters and Filters for information on the syntax to filter images/views, and the Testing Image Sample Set topic for more information on possible usages of the filter.
Processing Time
Individual tool processing time is displayed in the Database Overview, as shown below:
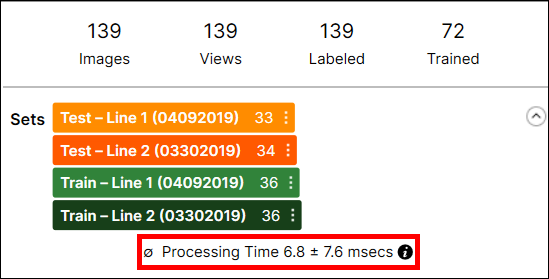
Processing Time is the average processing time per image in the last processing task, and it is the sum of the processing time and the post-processing time. The processing time for a stream containing multiple tools is not available through the VisionPro Deep Learning GUI, and you cannot estimate it by summing the tool execution time of the tools in the stream because the processing time includes the time required to prepare and transmit view information between tools.
Result Metrics
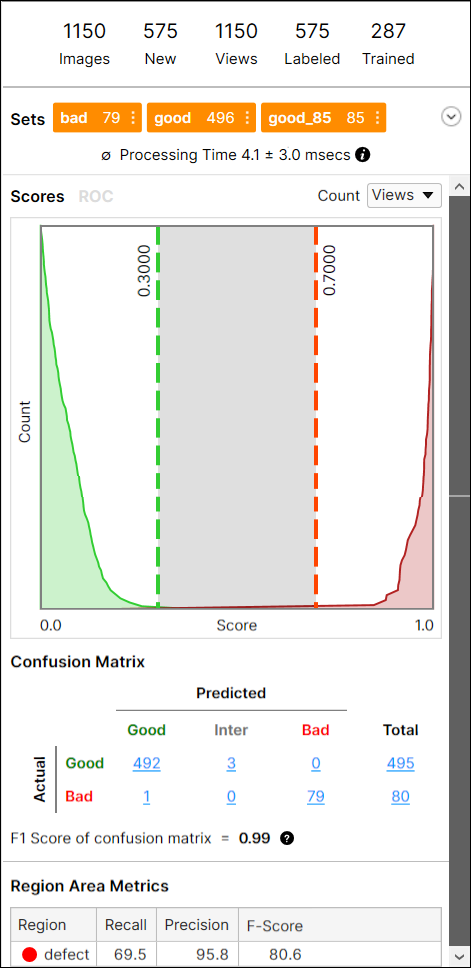
For the Red Analyze tool , once the tool has been trained, results will be displayed on the Database Overview pane in graphs and confusion matrix forms, depending on the tool's Mode - Supervised (Red Analyze Focused Supervised, Red Analyze High Detail) or Unsupervised (Red Analyze Focused Unsupervised).
The metrics output by the Red Analyze High Detail is given:
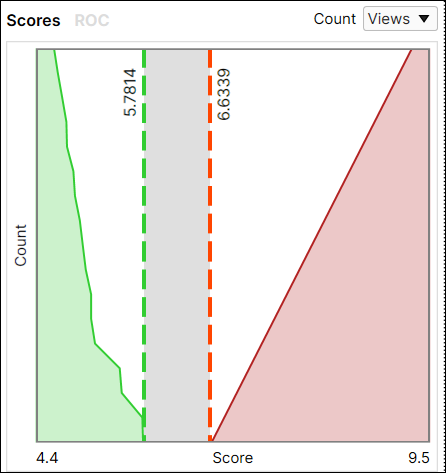
- Score Histogram
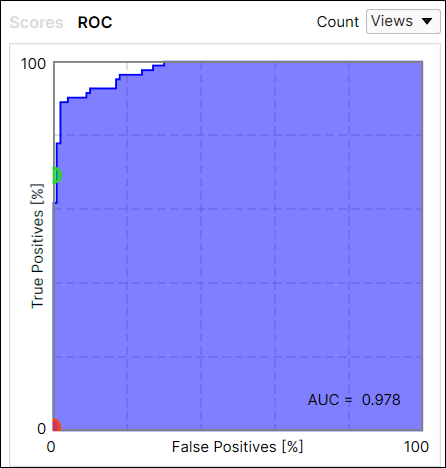
- Receiver Operating Characteristic (ROC) Curve and Area Under the Curve (AUC)
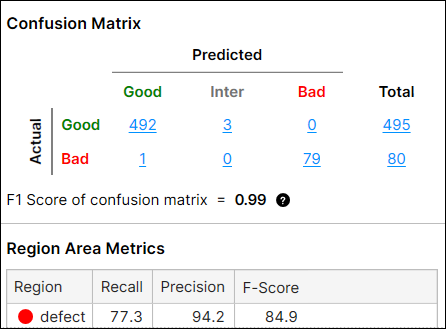
- Confusion Matrix (Precision, Recall and F-Score)
- Region Area Metrics (Precision, Recall and F-Score)
When the Red Analyze tool is in Supervised mode, there are additional Region Area Metrics included below the Confusion Matrix. The Region Area Metrics return data about the Recall, Precision and F-Score of the currently trained tool. Recall refers to how likely the tool is to find a defect in a given image; Precision is how likely the tool is to find a defect where there is an actual defect; and F-Score is average of Recall and Precision. Note that these 3 metrics on Region Area Metrics are calculated in pixels whereas the F1 Score of confusion matrix is calculated in a different way.
Basic Concepts: False Positives, False Negatives
In addition to the Statistical Results components, it is also important to understand how they affect False Positive and False Negative results.
Assume that there is an image inspection system that is built for capturing defects in images. If it captures one or more defects in an image, let's say the inspection result for that image is Positive, and if it captures no defect at all, the inspection result for that image is Negative. Then, the statistical results of the inspection task can be summarized into the followings:
-
False Positive (also known as a Type I Error)
-
An inspection system identifies a view or a pixel defective, but this view or pixel does not actually have a defect.
-
-
False Negative (also known as a Type II Error)
-
An inspection system could not identify a view or a pixel defective, but this view or pixel should have been identified defective.
-
Basic Concepts: Precision, Recall, F-Score
The False Positives and False Negatives are then summarized and represented again using the following metrics, which are the Precision and Recall, the statistical results used in all VisionPro Deep Learning tools.
- Precision
- A neural network with a low Precision typically fails to correctly grab the defects that should have been detected from given image data (test data), and so it returns many False Positive judgments (Type 1 Errors).
- A neural network with a high Precision typically succeeds to correctly grab the defects from given image data (test data), but if combined with low Recall, there is a possibility yet that there could be many False Negative judgments (Type 2 Errors)
- Recall
- A neural network with a low Recall typically fails to sufficiently grab the defects that should have been detected from given image data (test data), and so it returns many False Negative judgments (Type 2 Errors).
- A neural network with a high Recall typically succeeds to sufficiently grab the defects from given image data (test data), but if combined with low Precision, there is a possibility yet that there could be many False Positive judgments (Type 1 Errors)
To sum up,
- Precision - The percentage of detected defects that match the labeled defects.
- Recall - The percentage of detected defects that are correctly identified by the tool.
- F-Score - The harmonic mean of Recall and Precision.
The ideal statistical results for almost all inspection cases (there could be exceptional cases) includes high Precision and high Recall at the same time.